| __timestamp | The Boeing Company | W.W. Grainger, Inc. |
|---|---|---|
| Wednesday, January 1, 2014 | 90762000000 | 9964953000 |
| Thursday, January 1, 2015 | 96114000000 | 9973384000 |
| Friday, January 1, 2016 | 94571000000 | 10137204000 |
| Sunday, January 1, 2017 | 93392000000 | 10424858000 |
| Monday, January 1, 2018 | 101127000000 | 11221000000 |
| Tuesday, January 1, 2019 | 76559000000 | 11486000000 |
| Wednesday, January 1, 2020 | 58158000000 | 11797000000 |
| Friday, January 1, 2021 | 62286000000 | 13022000000 |
| Saturday, January 1, 2022 | 66608000000 | 15228000000 |
| Sunday, January 1, 2023 | 77794000000 | 16478000000 |
| Monday, January 1, 2024 | 66517000000 | 17168000000 |
Cracking the code
In the ever-evolving landscape of American industry, two titans stand out: The Boeing Company and W.W. Grainger, Inc. Over the past decade, these companies have showcased contrasting revenue trajectories. Boeing, a leader in aerospace, saw its revenue peak in 2018, only to face a significant downturn in 2019 and 2020, with a 42% drop from its 2018 high. This decline reflects the broader challenges faced by the aviation sector during the pandemic. In contrast, W.W. Grainger, a stalwart in industrial supply, demonstrated steady growth, with a remarkable 65% increase in revenue from 2014 to 2023. This resilience underscores the essential nature of its services, even in turbulent times. As we look to the future, Boeing's partial recovery in 2023 and Grainger's consistent upward trend paint a compelling picture of adaptability and resilience in American business.
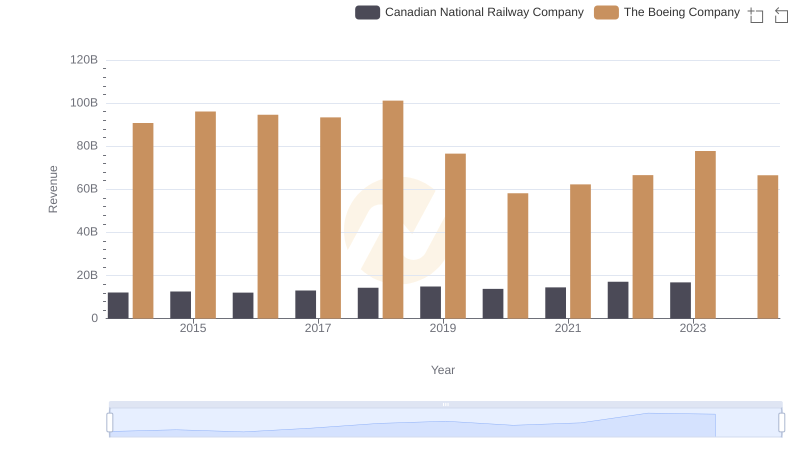
Comparing Revenue Performance: The Boeing Company or Canadian National Railway Company?
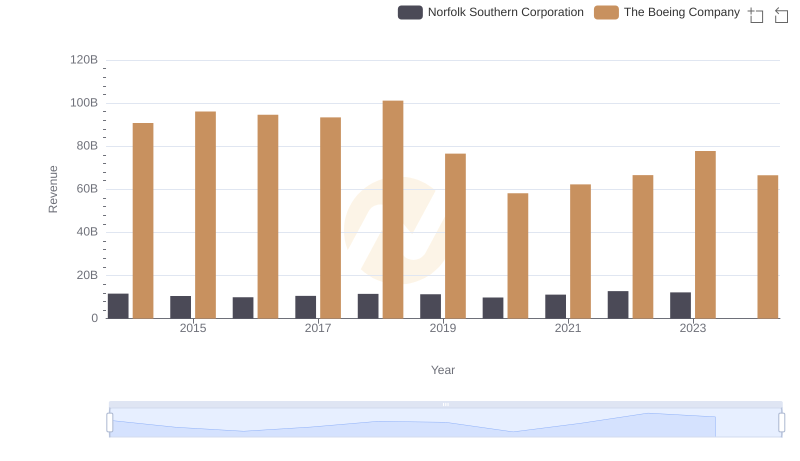
Who Generates More Revenue? The Boeing Company or Norfolk Southern Corporation
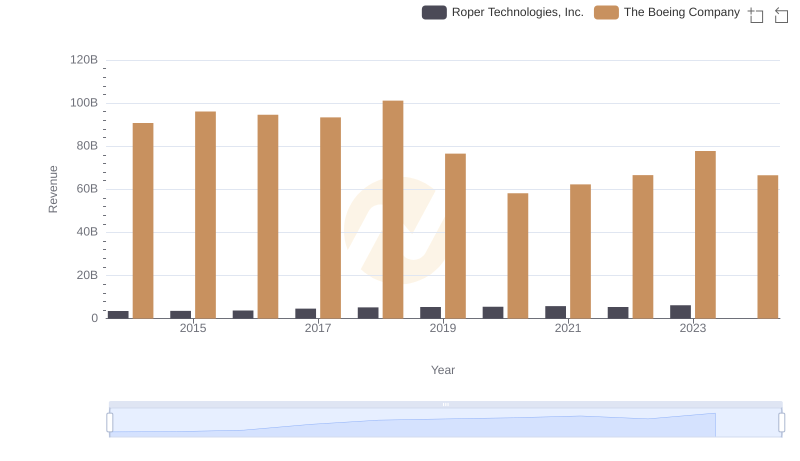
Revenue Insights: The Boeing Company and Roper Technologies, Inc. Performance Compared
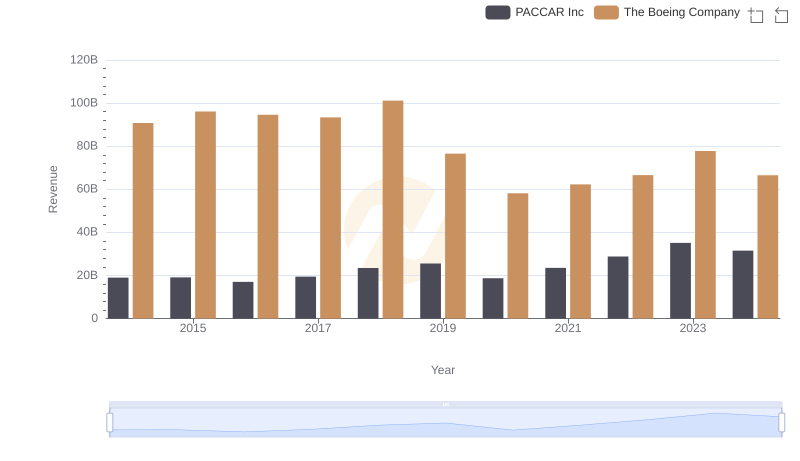
Revenue Insights: The Boeing Company and PACCAR Inc Performance Compared
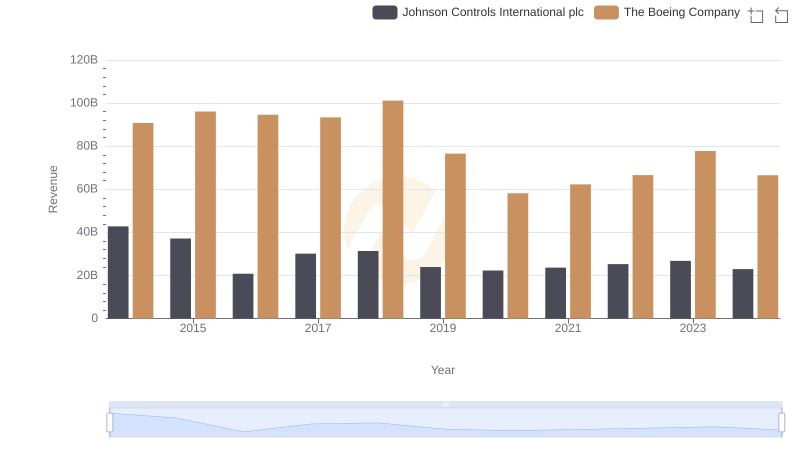
The Boeing Company vs Johnson Controls International plc: Examining Key Revenue Metrics
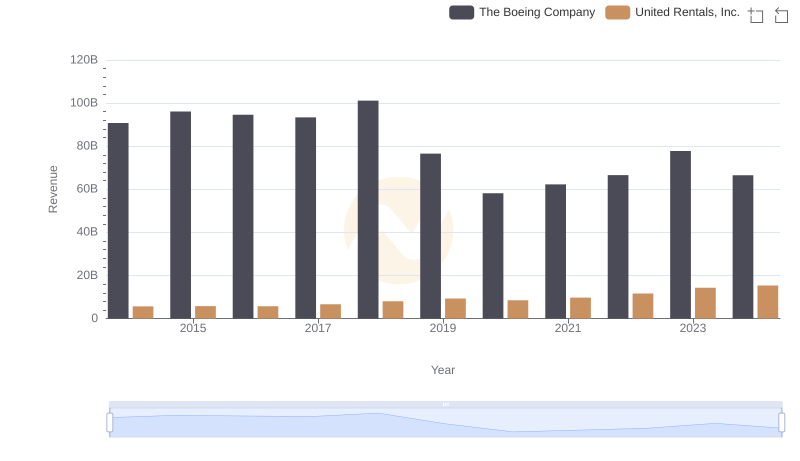
Revenue Insights: The Boeing Company and United Rentals, Inc. Performance Compared

The Boeing Company and Waste Connections, Inc.: A Comprehensive Revenue Analysis
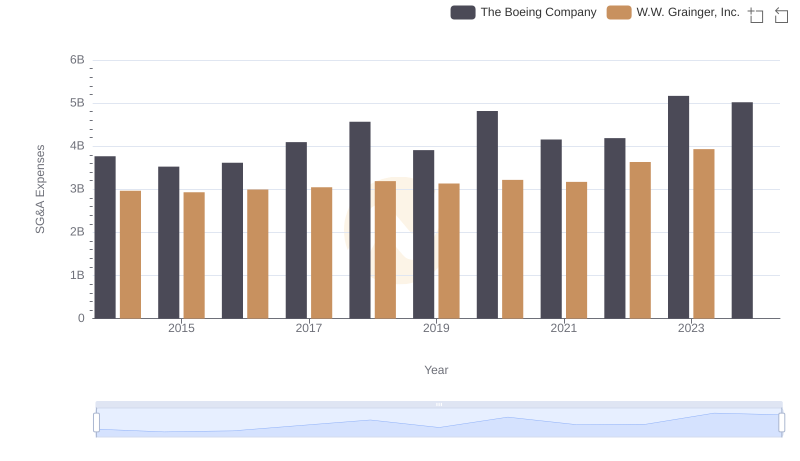
Selling, General, and Administrative Costs: The Boeing Company vs W.W. Grainger, Inc.