| __timestamp | Old Dominion Freight Line, Inc. | Watsco, Inc. |
|---|---|---|
| Wednesday, January 1, 2014 | 144817000 | 650655000 |
| Thursday, January 1, 2015 | 153589000 | 670609000 |
| Friday, January 1, 2016 | 152391000 | 688952000 |
| Sunday, January 1, 2017 | 177205000 | 715671000 |
| Monday, January 1, 2018 | 194368000 | 757452000 |
| Tuesday, January 1, 2019 | 206125000 | 800328000 |
| Wednesday, January 1, 2020 | 184185000 | 833051000 |
| Friday, January 1, 2021 | 223757000 | 1058316000 |
| Saturday, January 1, 2022 | 258883000 | 1221382000 |
| Sunday, January 1, 2023 | 281053000 | 1185626000 |
| Monday, January 1, 2024 | 1262938000 |
Igniting the spark of knowledge
In the world of logistics and distribution, managing costs is crucial for maintaining profitability. This chart compares the Selling, General, and Administrative (SG&A) expenses of Old Dominion Freight Line, Inc. and Watsco, Inc. from 2014 to 2023. Over this period, Watsco, Inc. consistently reported higher SG&A expenses, peaking in 2022 with a 22% increase from 2014. Meanwhile, Old Dominion Freight Line, Inc. saw a significant rise in their SG&A expenses, with a 94% increase over the same period, reflecting their strategic investments in growth and efficiency.
Understanding these trends provides valuable insights into each company's operational strategies and market positioning.
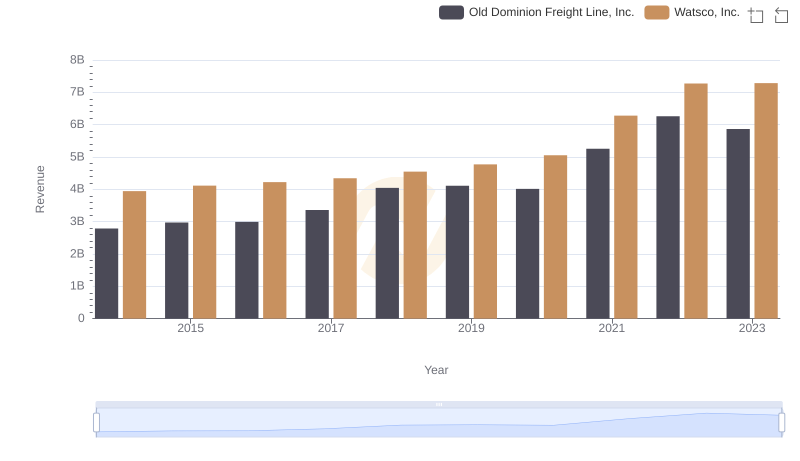
Revenue Showdown: Old Dominion Freight Line, Inc. vs Watsco, Inc.
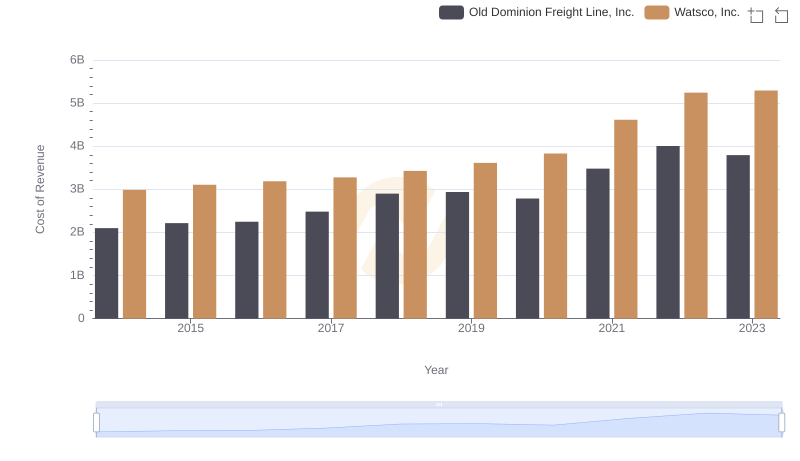
Cost of Revenue Trends: Old Dominion Freight Line, Inc. vs Watsco, Inc.
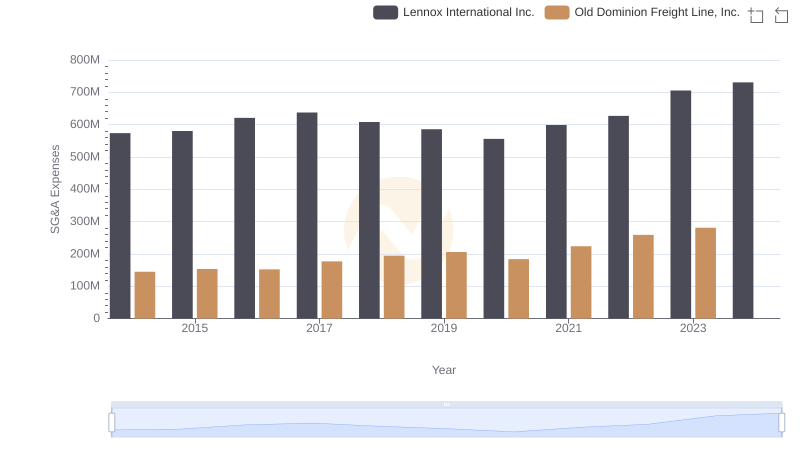
Breaking Down SG&A Expenses: Old Dominion Freight Line, Inc. vs Lennox International Inc.
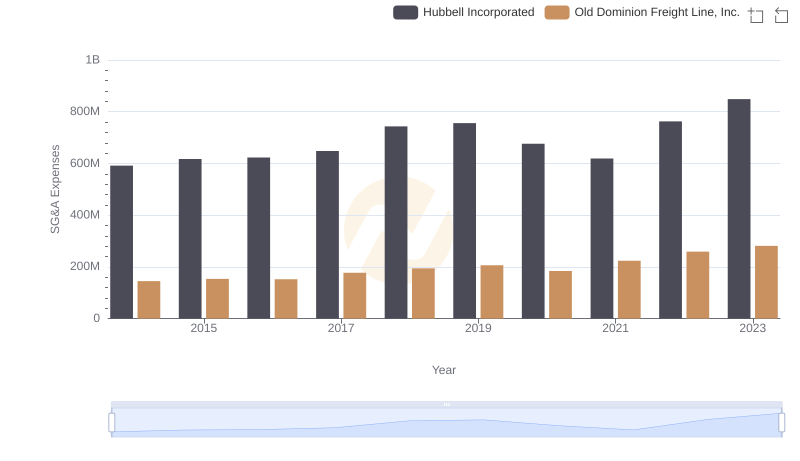
SG&A Efficiency Analysis: Comparing Old Dominion Freight Line, Inc. and Hubbell Incorporated
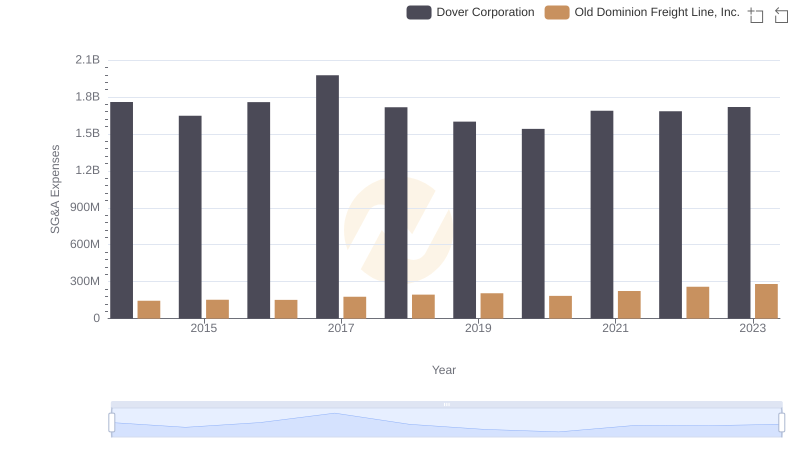
Old Dominion Freight Line, Inc. vs Dover Corporation: SG&A Expense Trends
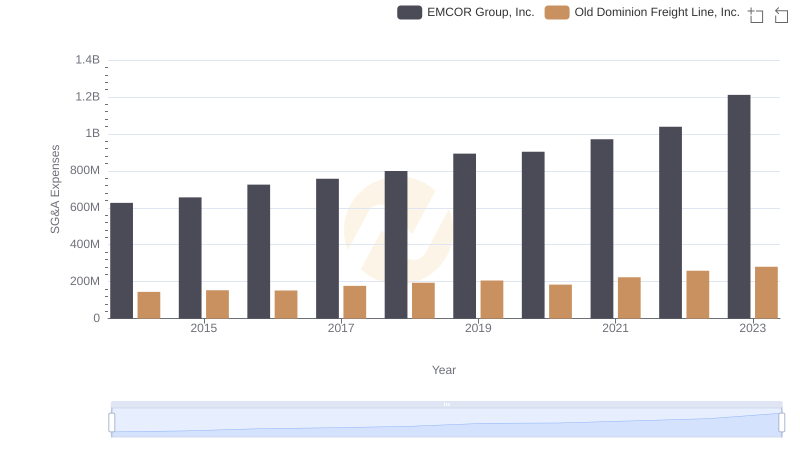
Old Dominion Freight Line, Inc. vs EMCOR Group, Inc.: SG&A Expense Trends
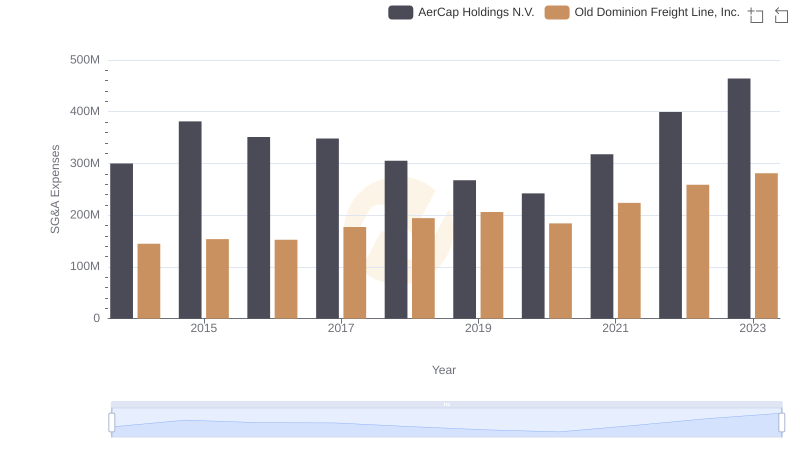
Comparing SG&A Expenses: Old Dominion Freight Line, Inc. vs AerCap Holdings N.V. Trends and Insights
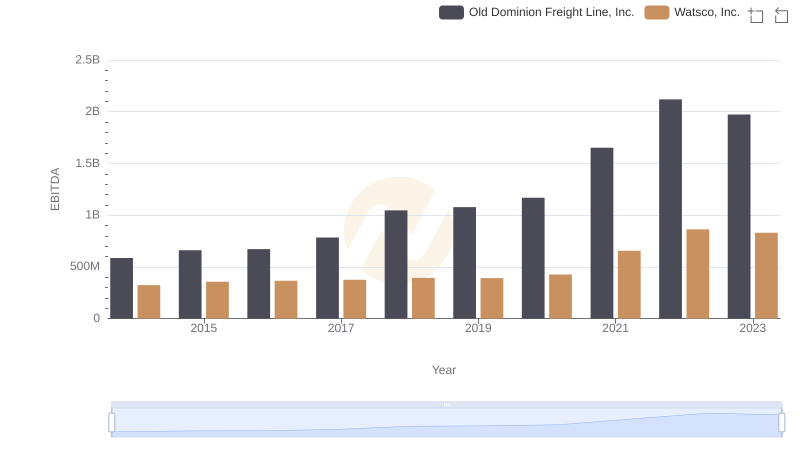
Old Dominion Freight Line, Inc. and Watsco, Inc.: A Detailed Examination of EBITDA Performance