| __timestamp | Global Payments Inc. | Stanley Black & Decker, Inc. |
|---|---|---|
| Wednesday, January 1, 2014 | 1295014000 | 2595900000 |
| Thursday, January 1, 2015 | 1325567000 | 2486400000 |
| Friday, January 1, 2016 | 1411096000 | 2623900000 |
| Sunday, January 1, 2017 | 1488258000 | 2980100000 |
| Monday, January 1, 2018 | 1534297000 | 3171700000 |
| Tuesday, January 1, 2019 | 2046672000 | 3041000000 |
| Wednesday, January 1, 2020 | 2878878000 | 3089600000 |
| Friday, January 1, 2021 | 3391161000 | 3240400000 |
| Saturday, January 1, 2022 | 3524578000 | 3370000000 |
| Sunday, January 1, 2023 | 4073768000 | 2829300000 |
| Monday, January 1, 2024 | 4285307000 | 3310500000 |
Data in motion
In the ever-evolving landscape of corporate finance, understanding the nuances of Selling, General, and Administrative (SG&A) expenses is crucial. Over the past decade, Global Payments Inc. and Stanley Black & Decker, Inc. have showcased distinct trajectories in their SG&A expenditures. From 2014 to 2023, Global Payments Inc. saw a staggering 214% increase in SG&A expenses, peaking in 2023. In contrast, Stanley Black & Decker, Inc. experienced a more modest 9% growth, with a notable dip in 2023. This divergence highlights the dynamic strategies and operational scales of these industry giants. As businesses navigate the complexities of the modern market, such insights into SG&A trends offer invaluable perspectives for investors and analysts alike.
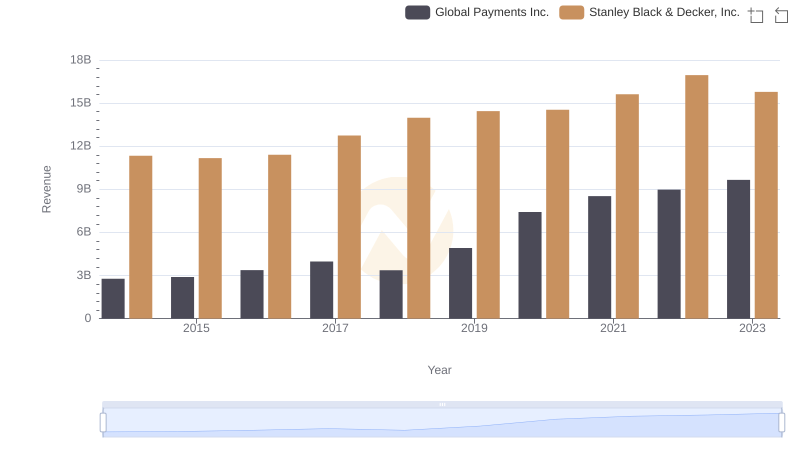
Global Payments Inc. vs Stanley Black & Decker, Inc.: Examining Key Revenue Metrics
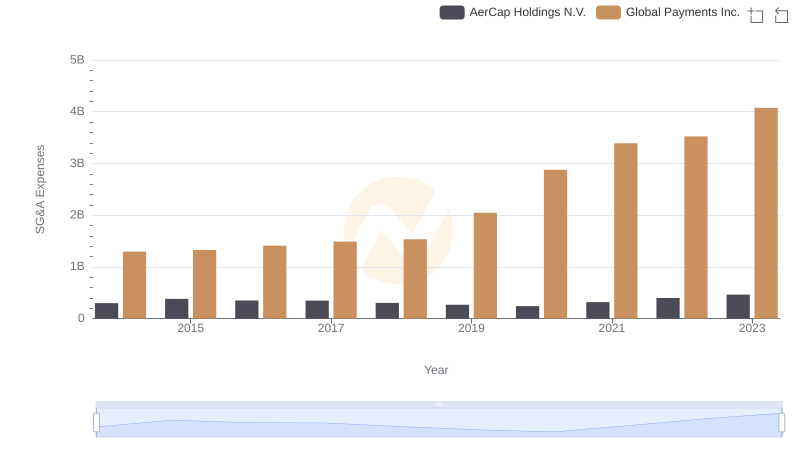
Cost Management Insights: SG&A Expenses for Global Payments Inc. and AerCap Holdings N.V.
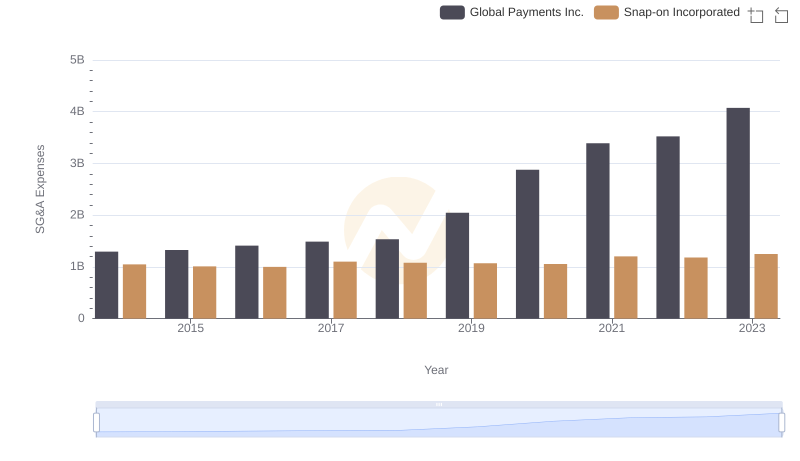
Operational Costs Compared: SG&A Analysis of Global Payments Inc. and Snap-on Incorporated
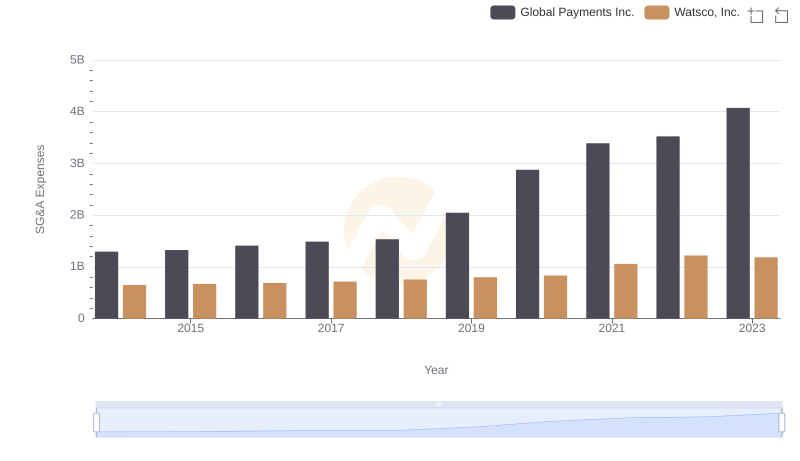
Global Payments Inc. vs Watsco, Inc.: SG&A Expense Trends
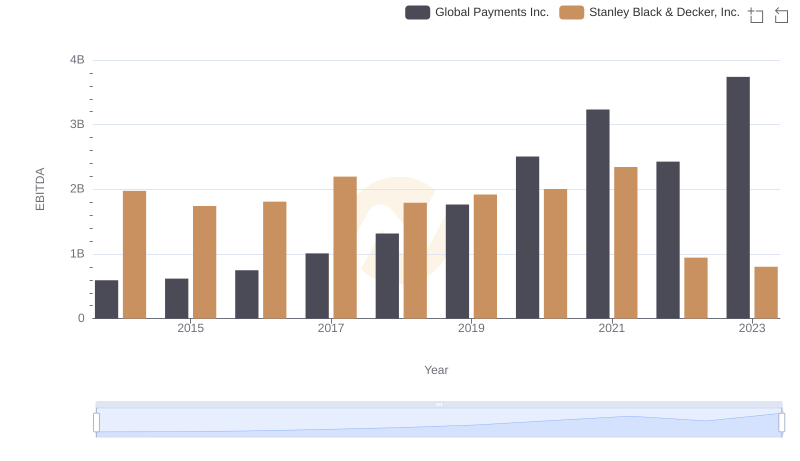
EBITDA Metrics Evaluated: Global Payments Inc. vs Stanley Black & Decker, Inc.

Revenue Insights: Global Payments Inc. and Stanley Black & Decker, Inc. Performance Compared
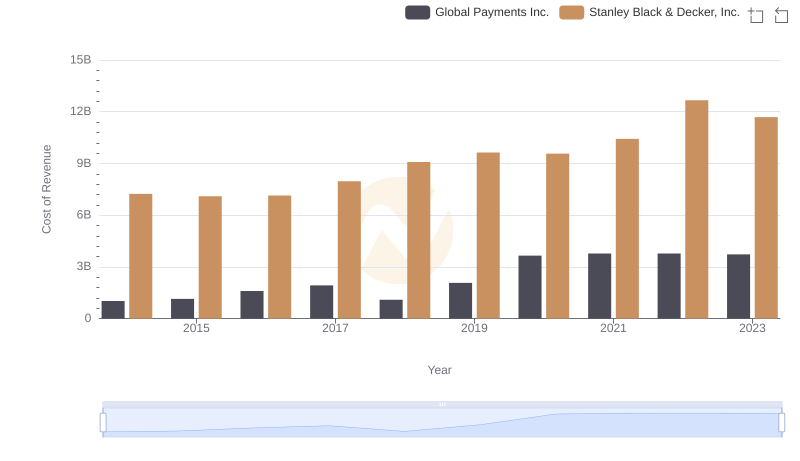
Cost of Revenue Trends: Global Payments Inc. vs Stanley Black & Decker, Inc.
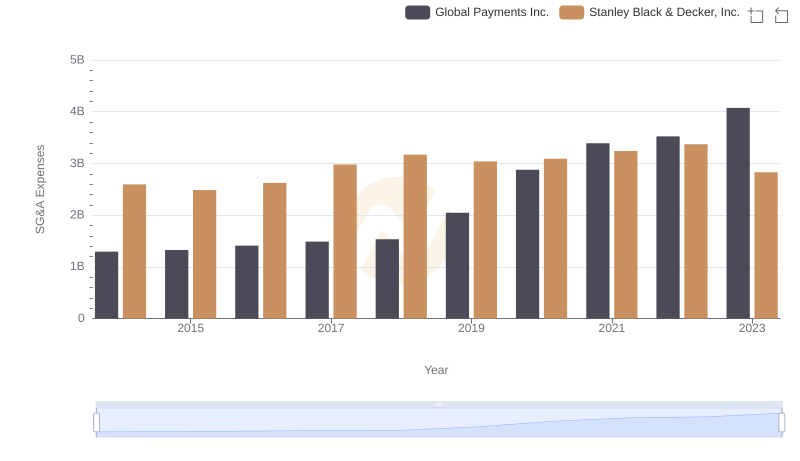
Breaking Down SG&A Expenses: Global Payments Inc. vs Stanley Black & Decker, Inc.

Comprehensive EBITDA Comparison: Global Payments Inc. vs Stanley Black & Decker, Inc.