| __timestamp | AMETEK, Inc. | EMCOR Group, Inc. |
|---|---|---|
| Wednesday, January 1, 2014 | 1424947000 | 907246000 |
| Thursday, January 1, 2015 | 1425015000 | 944479000 |
| Friday, January 1, 2016 | 1264867000 | 1037862000 |
| Sunday, January 1, 2017 | 1448739000 | 1147012000 |
| Monday, January 1, 2018 | 1659562000 | 1205453000 |
| Tuesday, January 1, 2019 | 1787660000 | 1355868000 |
| Wednesday, January 1, 2020 | 1543514000 | 1395382000 |
| Friday, January 1, 2021 | 1912614000 | 1501737000 |
| Saturday, January 1, 2022 | 2145269000 | 1603594000 |
| Sunday, January 1, 2023 | 2384465001 | 2089339000 |
| Monday, January 1, 2024 | 6941180000 |
Unleashing the power of data
In the ever-evolving landscape of industrial and engineering services, AMETEK, Inc. and EMCOR Group, Inc. have emerged as formidable players. Over the past decade, these companies have demonstrated remarkable growth in their gross profits, reflecting their strategic prowess and market adaptability.
From 2014 to 2023, AMETEK's gross profit surged by approximately 67%, showcasing its robust expansion and operational efficiency. Meanwhile, EMCOR Group, Inc. experienced an impressive 130% increase, highlighting its dynamic growth trajectory and resilience in the face of market challenges.
The year 2023 marked a significant milestone, with AMETEK achieving a gross profit of $2.38 billion, while EMCOR Group, Inc. reached $2.09 billion. This data underscores the competitive nature of the industry and the relentless pursuit of excellence by these two giants.
As we look to the future, the trends suggest continued growth and innovation, promising exciting developments in the industrial sector.
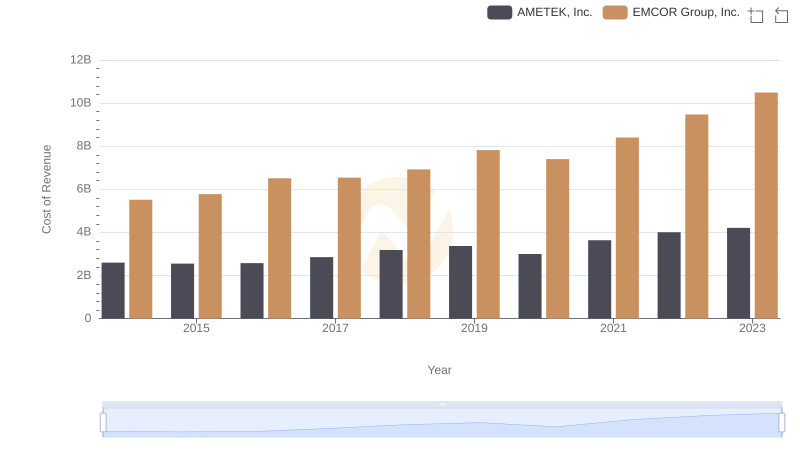
Cost of Revenue Trends: AMETEK, Inc. vs EMCOR Group, Inc.
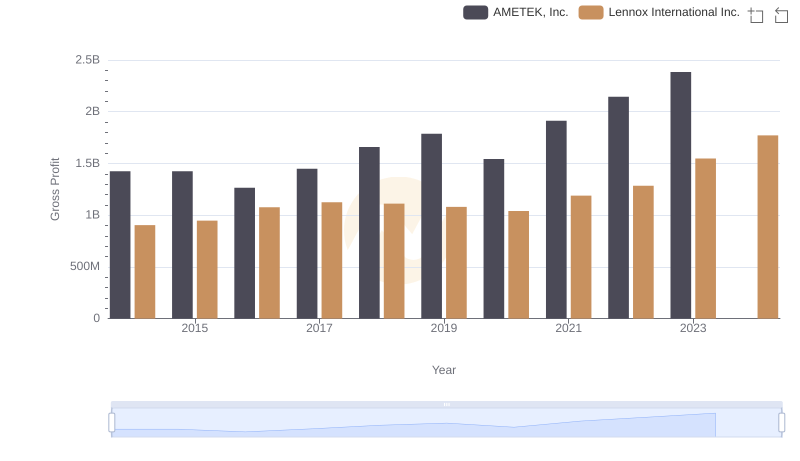
Gross Profit Analysis: Comparing AMETEK, Inc. and Lennox International Inc.
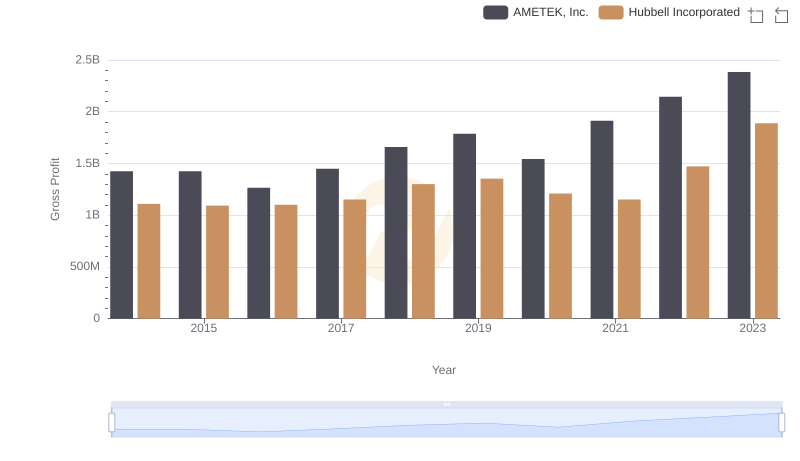
Gross Profit Analysis: Comparing AMETEK, Inc. and Hubbell Incorporated
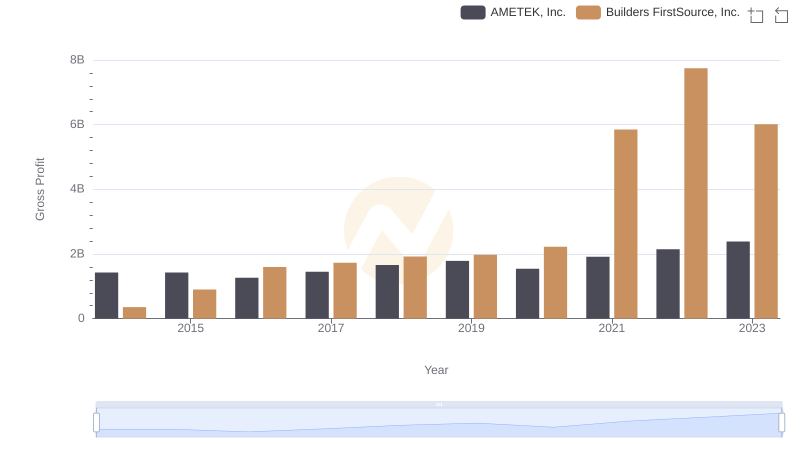
Gross Profit Trends Compared: AMETEK, Inc. vs Builders FirstSource, Inc.
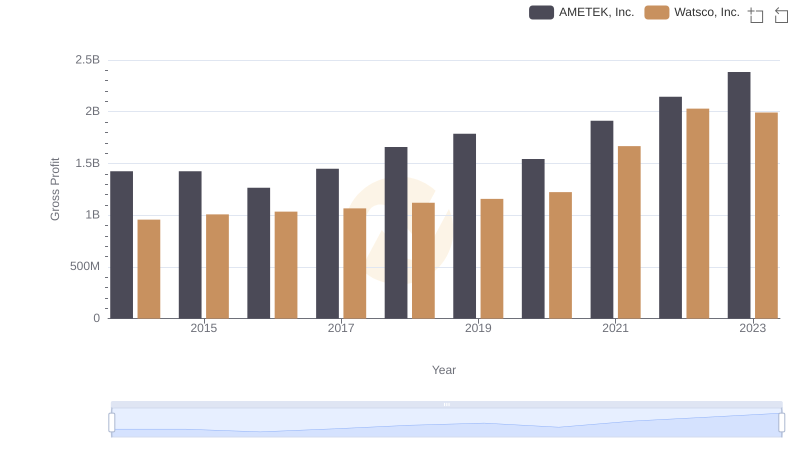
AMETEK, Inc. vs Watsco, Inc.: A Gross Profit Performance Breakdown
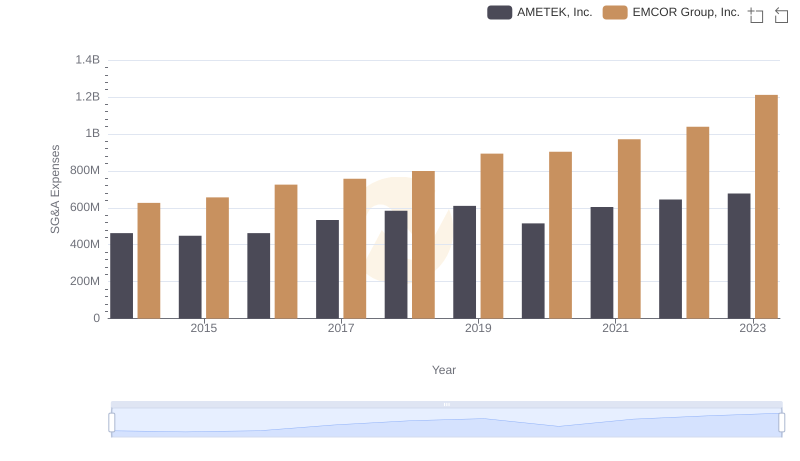
Selling, General, and Administrative Costs: AMETEK, Inc. vs EMCOR Group, Inc.