| __timestamp | AMETEK, Inc. | EMCOR Group, Inc. |
|---|---|---|
| Wednesday, January 1, 2014 | 2597017000 | 5517719000 |
| Thursday, January 1, 2015 | 2549280000 | 5774247000 |
| Friday, January 1, 2016 | 2575220000 | 6513662000 |
| Sunday, January 1, 2017 | 2851431000 | 6539987000 |
| Monday, January 1, 2018 | 3186310000 | 6925178000 |
| Tuesday, January 1, 2019 | 3370897000 | 7818743000 |
| Wednesday, January 1, 2020 | 2996515000 | 7401679000 |
| Friday, January 1, 2021 | 3633900000 | 8401843000 |
| Saturday, January 1, 2022 | 4005261000 | 9472526000 |
| Sunday, January 1, 2023 | 4212484999 | 10493534000 |
| Monday, January 1, 2024 | 0 |
Unleashing insights
In the ever-evolving landscape of industrial manufacturing and construction services, AMETEK, Inc. and EMCOR Group, Inc. stand as titans. Over the past decade, from 2014 to 2023, these companies have showcased distinct trajectories in their cost of revenue. AMETEK, Inc. has seen a steady increase, with costs rising by approximately 62% from 2014 to 2023. This growth reflects their strategic investments and expansion in the electronic instruments and electromechanical devices sectors. Meanwhile, EMCOR Group, Inc., a leader in mechanical and electrical construction services, has experienced a more pronounced surge, with costs escalating by nearly 90% over the same period. This trend underscores EMCOR's robust growth in infrastructure and building services. As these companies continue to innovate and expand, their cost of revenue trends offer valuable insights into their operational strategies and market dynamics.

Cost Insights: Breaking Down AMETEK, Inc. and Hubbell Incorporated's Expenses
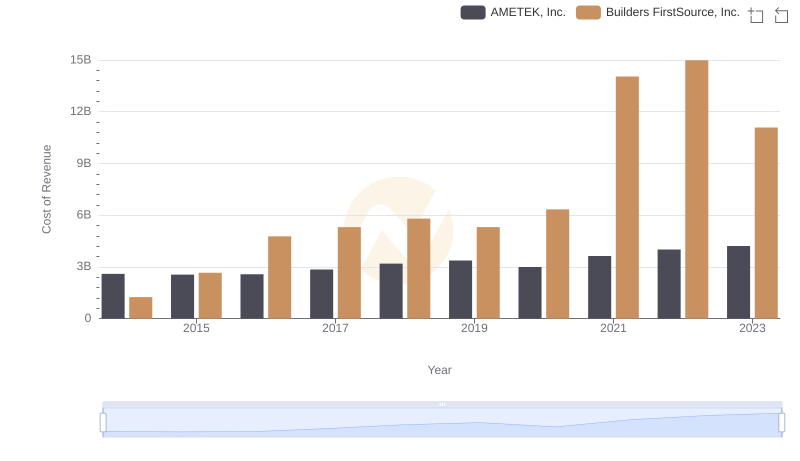
Cost of Revenue Comparison: AMETEK, Inc. vs Builders FirstSource, Inc.
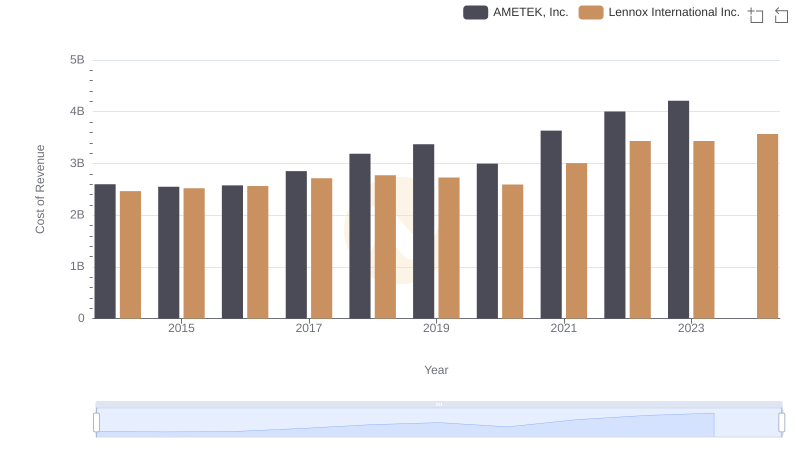
Cost of Revenue Comparison: AMETEK, Inc. vs Lennox International Inc.
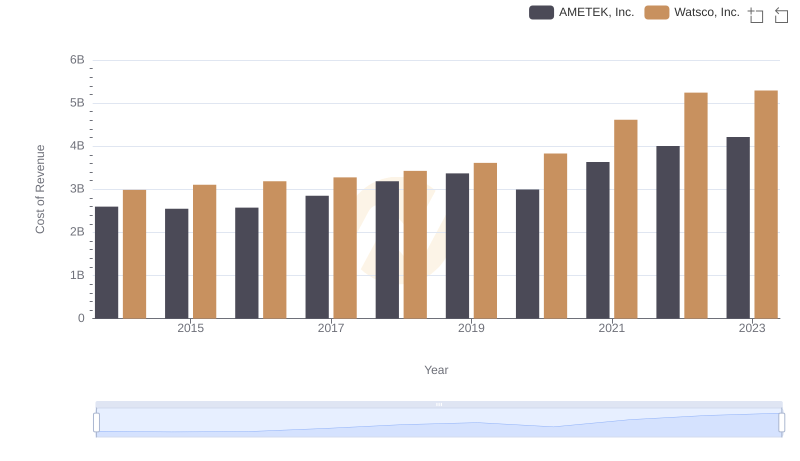
Comparing Cost of Revenue Efficiency: AMETEK, Inc. vs Watsco, Inc.
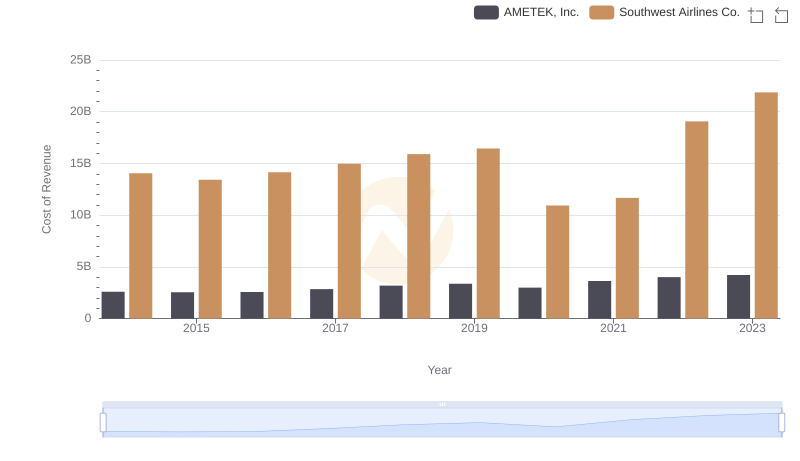
Cost Insights: Breaking Down AMETEK, Inc. and Southwest Airlines Co.'s Expenses
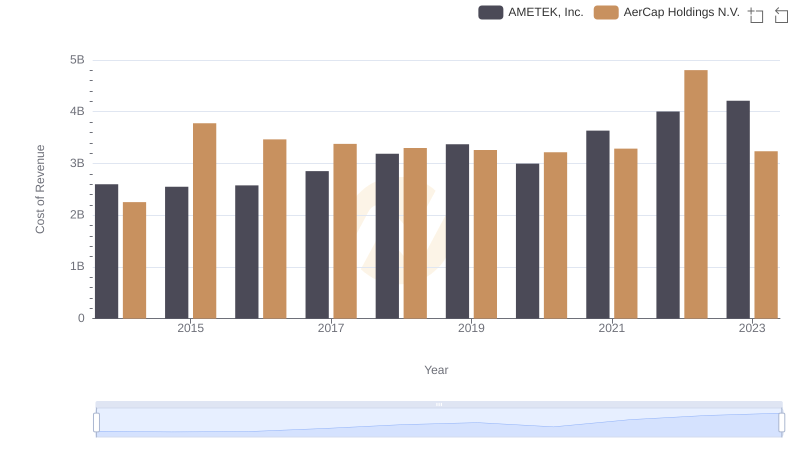
Cost of Revenue: Key Insights for AMETEK, Inc. and AerCap Holdings N.V.
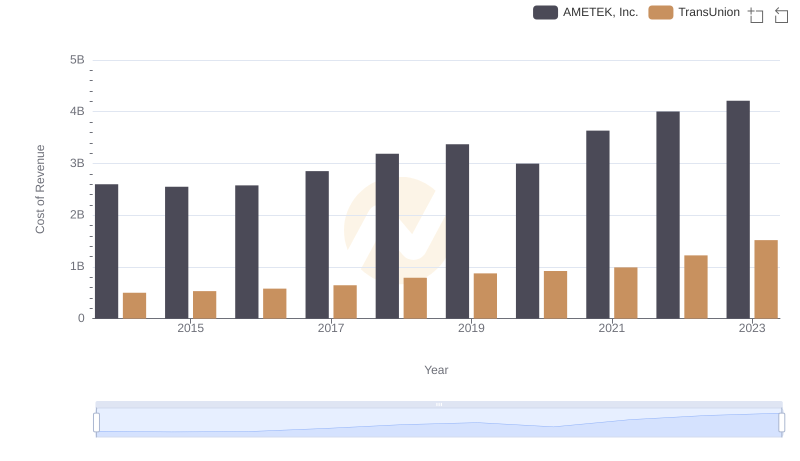
Cost of Revenue: Key Insights for AMETEK, Inc. and TransUnion
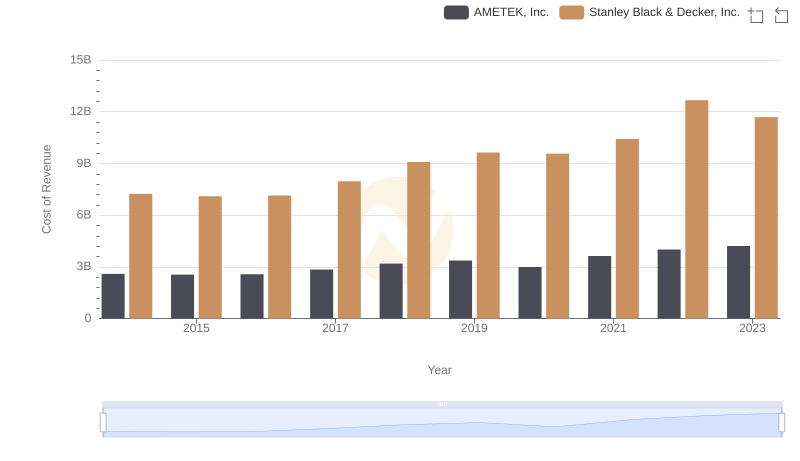
Comparing Cost of Revenue Efficiency: AMETEK, Inc. vs Stanley Black & Decker, Inc.

Gross Profit Trends Compared: AMETEK, Inc. vs EMCOR Group, Inc.
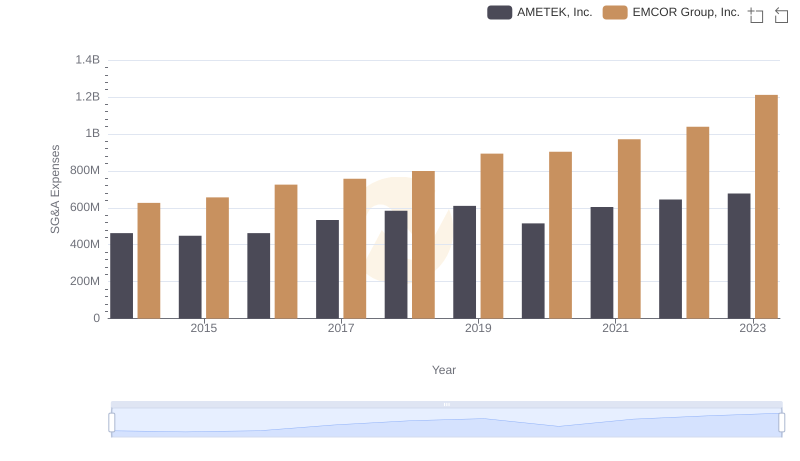
Selling, General, and Administrative Costs: AMETEK, Inc. vs EMCOR Group, Inc.