| __timestamp | AMETEK, Inc. | Snap-on Incorporated |
|---|---|---|
| Wednesday, January 1, 2014 | 462637000 | 1047900000 |
| Thursday, January 1, 2015 | 448592000 | 1009100000 |
| Friday, January 1, 2016 | 462970000 | 1001400000 |
| Sunday, January 1, 2017 | 533645000 | 1101300000 |
| Monday, January 1, 2018 | 584022000 | 1080700000 |
| Tuesday, January 1, 2019 | 610280000 | 1071500000 |
| Wednesday, January 1, 2020 | 515630000 | 1054800000 |
| Friday, January 1, 2021 | 603944000 | 1202300000 |
| Saturday, January 1, 2022 | 644577000 | 1181200000 |
| Sunday, January 1, 2023 | 677006000 | 1249000000 |
| Monday, January 1, 2024 | 696905000 | 0 |
Unleashing insights
In the competitive landscape of industrial manufacturing, understanding the financial health of companies is crucial. This analysis delves into the Selling, General, and Administrative (SG&A) expenses of AMETEK, Inc. and Snap-on Incorporated from 2014 to 2023. Over this period, Snap-on consistently outspent AMETEK, with SG&A expenses peaking at approximately $1.25 billion in 2023, marking a 25% increase from 2014. In contrast, AMETEK's expenses grew by about 46%, reaching nearly $677 million in 2023. This trend highlights Snap-on's larger scale of operations, while AMETEK's rapid growth in expenses suggests aggressive expansion or increased operational costs. Such insights are vital for investors and stakeholders aiming to gauge the strategic directions and financial strategies of these industrial giants.
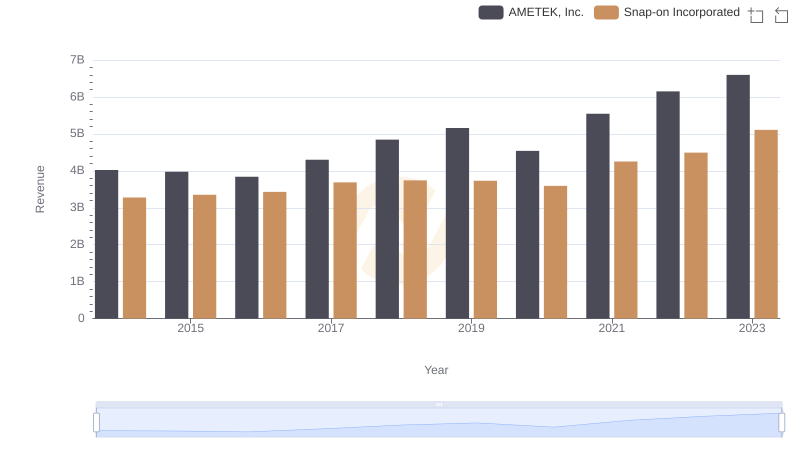
Annual Revenue Comparison: AMETEK, Inc. vs Snap-on Incorporated
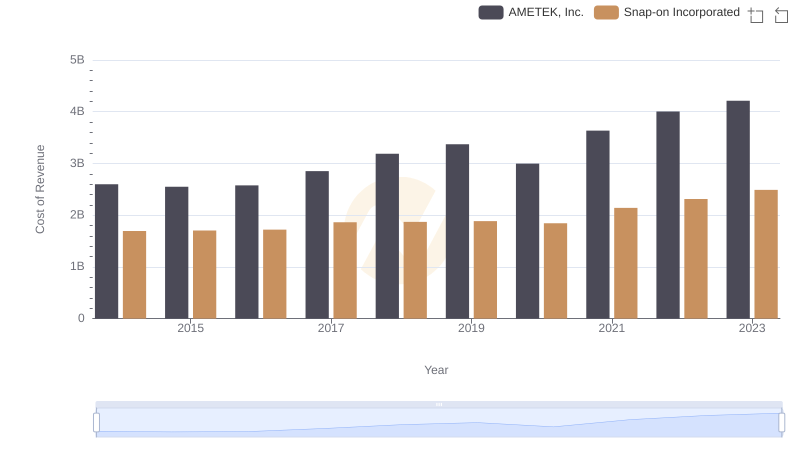
Cost of Revenue Trends: AMETEK, Inc. vs Snap-on Incorporated
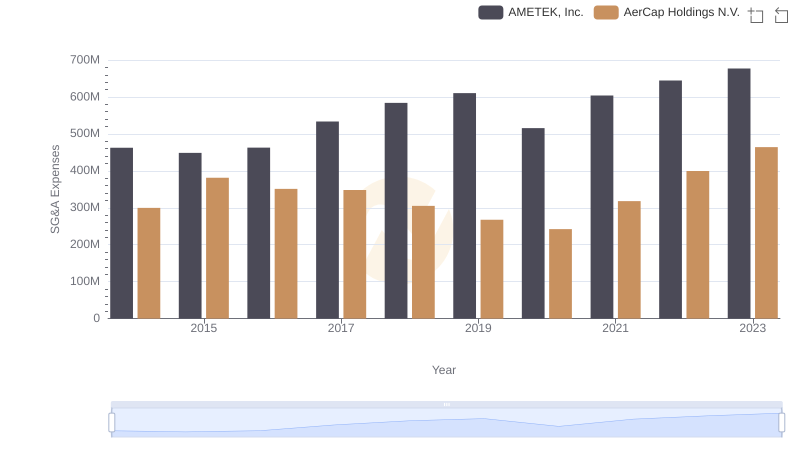
Selling, General, and Administrative Costs: AMETEK, Inc. vs AerCap Holdings N.V.
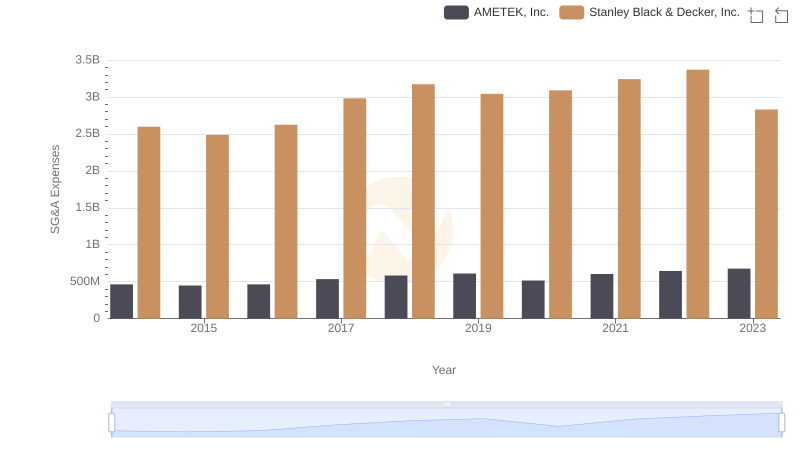
AMETEK, Inc. and Stanley Black & Decker, Inc.: SG&A Spending Patterns Compared

AMETEK, Inc. or TransUnion: Who Manages SG&A Costs Better?
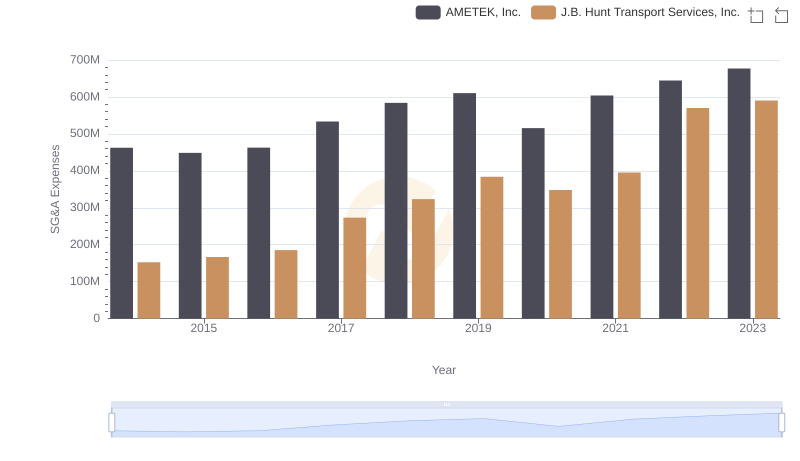
AMETEK, Inc. and J.B. Hunt Transport Services, Inc.: SG&A Spending Patterns Compared
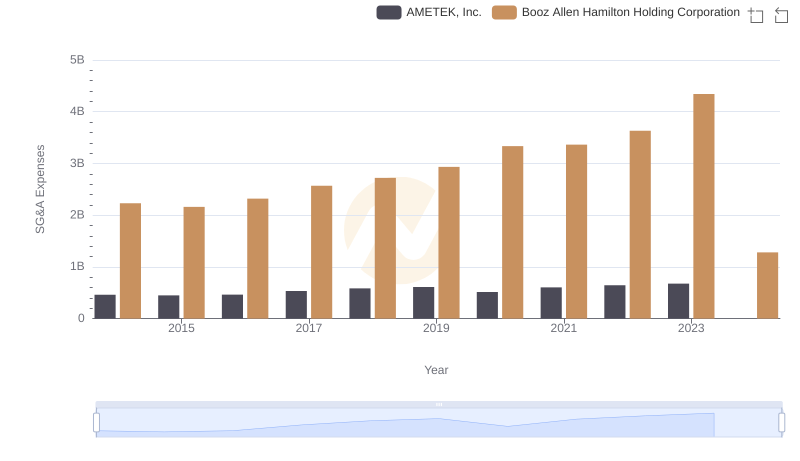
AMETEK, Inc. or Booz Allen Hamilton Holding Corporation: Who Manages SG&A Costs Better?
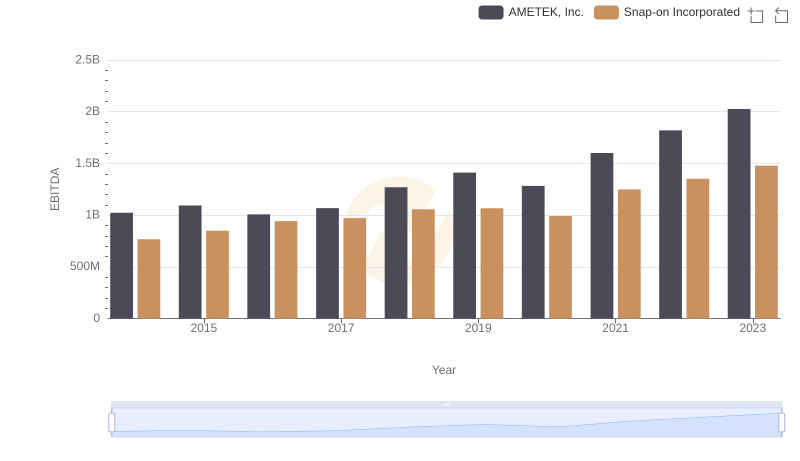
A Side-by-Side Analysis of EBITDA: AMETEK, Inc. and Snap-on Incorporated
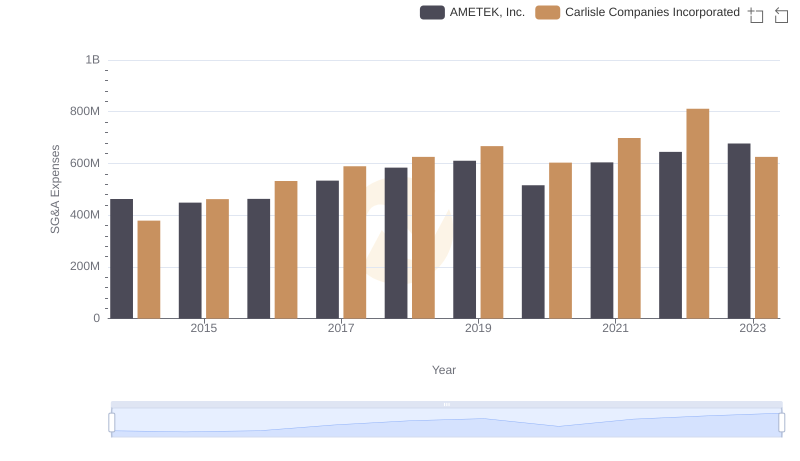
AMETEK, Inc. and Carlisle Companies Incorporated: SG&A Spending Patterns Compared
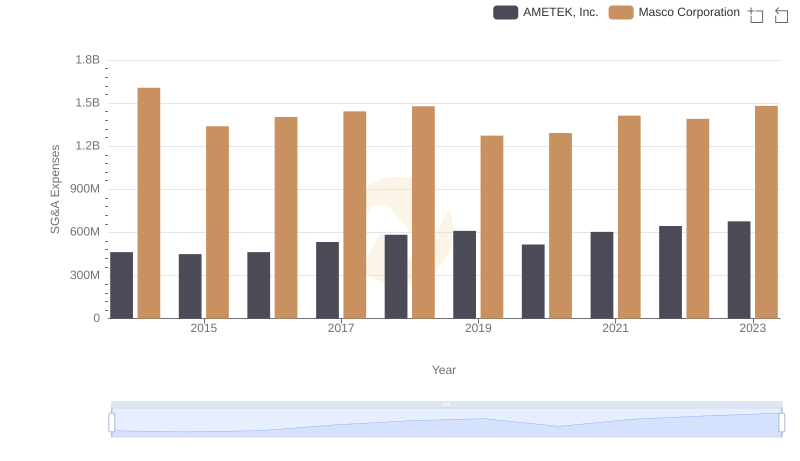
Cost Management Insights: SG&A Expenses for AMETEK, Inc. and Masco Corporation