| __timestamp | Rentokil Initial plc | Ryanair Holdings plc |
|---|---|---|
| Wednesday, January 1, 2014 | 297500000 | 3838100000 |
| Thursday, January 1, 2015 | 310200000 | 3999600000 |
| Friday, January 1, 2016 | 376100000 | 4355900000 |
| Sunday, January 1, 2017 | 474900000 | 4294000000 |
| Monday, January 1, 2018 | 514200000 | 4512300000 |
| Tuesday, January 1, 2019 | 2099000000 | 5492800000 |
| Wednesday, January 1, 2020 | 2136400000 | 6039900000 |
| Friday, January 1, 2021 | 2239100000 | 1702700000 |
| Saturday, January 1, 2022 | 2737000000 | 4009800000 |
| Sunday, January 1, 2023 | 927000000 | 7735000000 |
| Monday, January 1, 2024 | 9566400000 |
Data in motion
In the ever-evolving landscape of global business, understanding the cost of revenue is crucial for evaluating a company's financial health. This analysis delves into the cost of revenue trends for Ryanair Holdings plc and Rentokil Initial plc from 2014 to 2023. Ryanair, a leader in the airline industry, has seen its cost of revenue grow by approximately 150% over the decade, peaking in 2023. This reflects its aggressive expansion and operational strategies. In contrast, Rentokil Initial, a key player in the pest control and hygiene services sector, experienced a more modest increase of around 210% until 2022, with a notable dip in 2023. This fluctuation could be attributed to market dynamics and strategic shifts. The data highlights the distinct financial trajectories of these companies, offering valuable insights for investors and industry analysts.
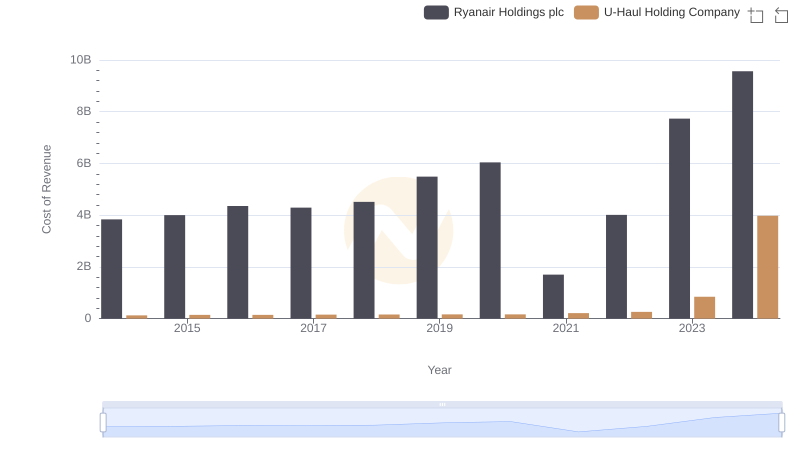
Ryanair Holdings plc vs U-Haul Holding Company: Efficiency in Cost of Revenue Explored
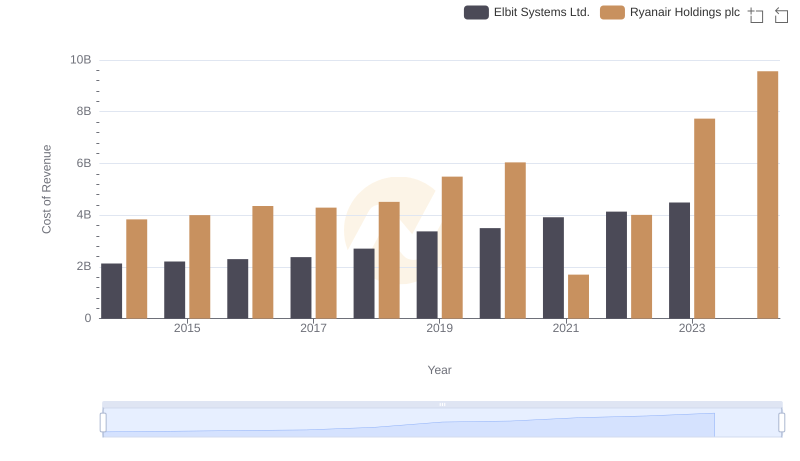
Analyzing Cost of Revenue: Ryanair Holdings plc and Elbit Systems Ltd.
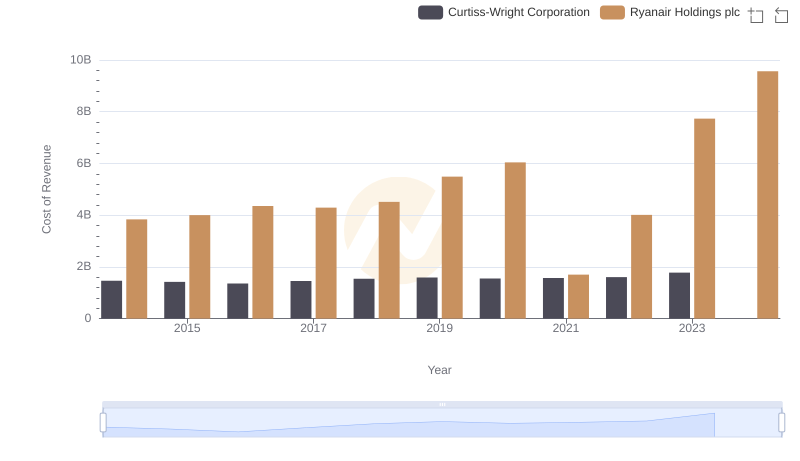
Cost of Revenue Trends: Ryanair Holdings plc vs Curtiss-Wright Corporation
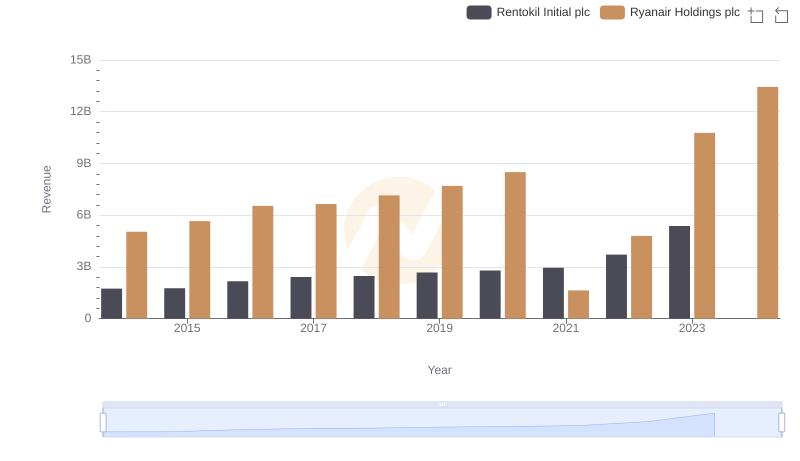
Annual Revenue Comparison: Ryanair Holdings plc vs Rentokil Initial plc
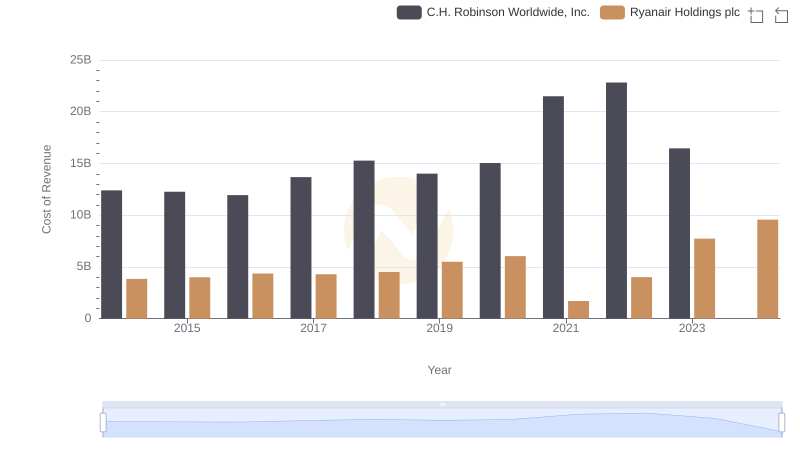
Cost Insights: Breaking Down Ryanair Holdings plc and C.H. Robinson Worldwide, Inc.'s Expenses
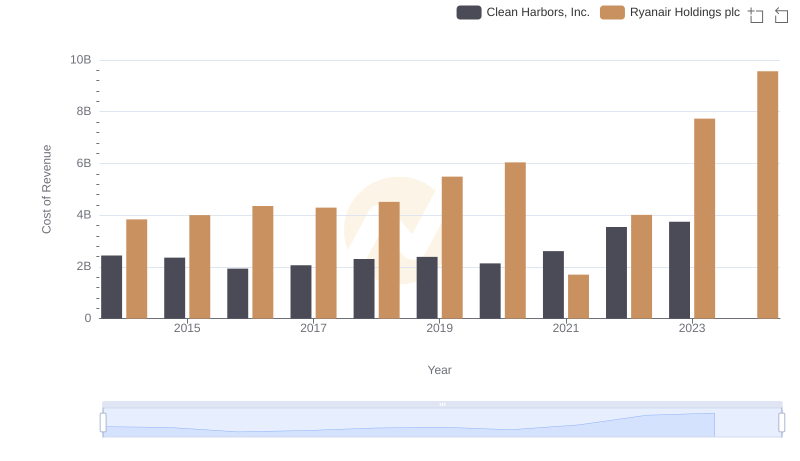
Cost of Revenue Trends: Ryanair Holdings plc vs Clean Harbors, Inc.
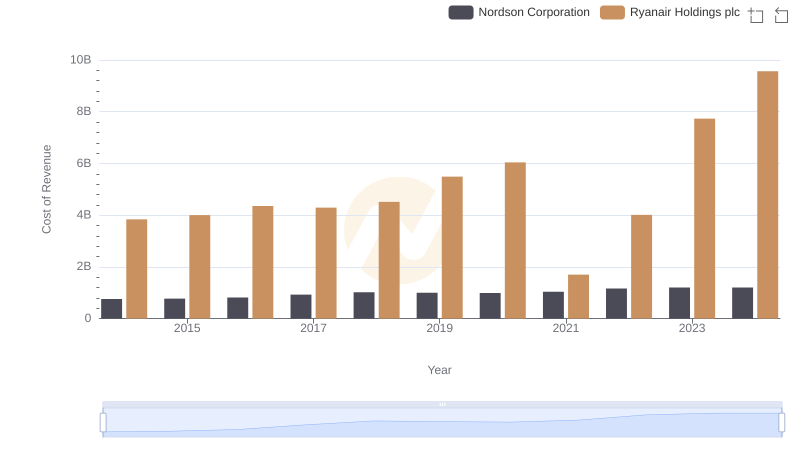
Cost Insights: Breaking Down Ryanair Holdings plc and Nordson Corporation's Expenses
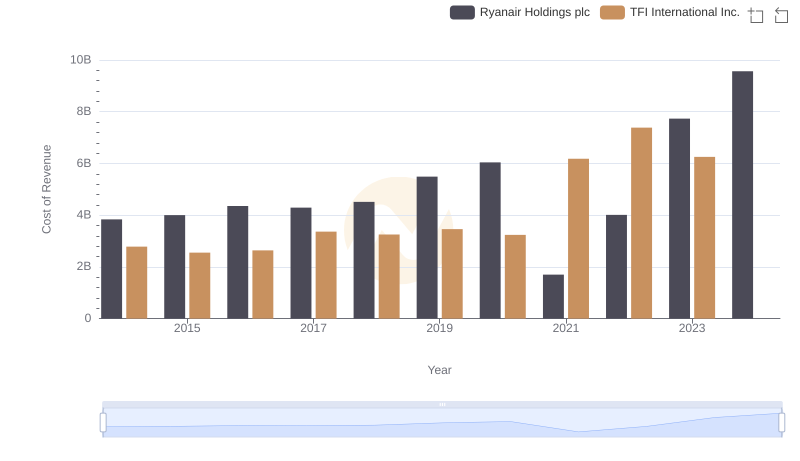
Cost Insights: Breaking Down Ryanair Holdings plc and TFI International Inc.'s Expenses
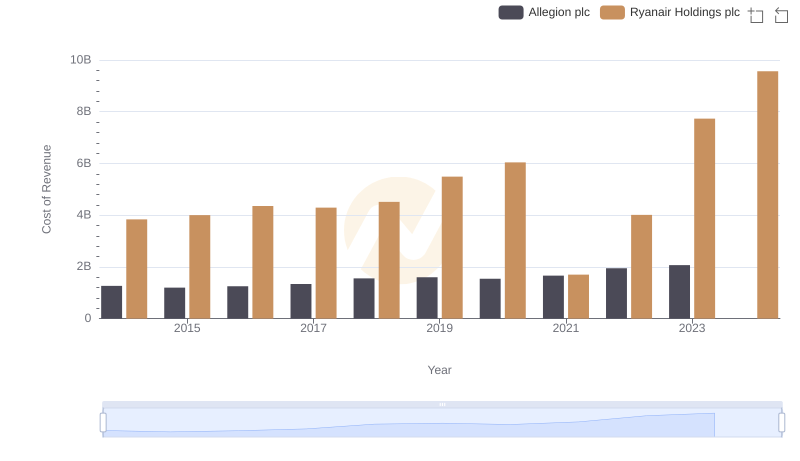
Cost Insights: Breaking Down Ryanair Holdings plc and Allegion plc's Expenses
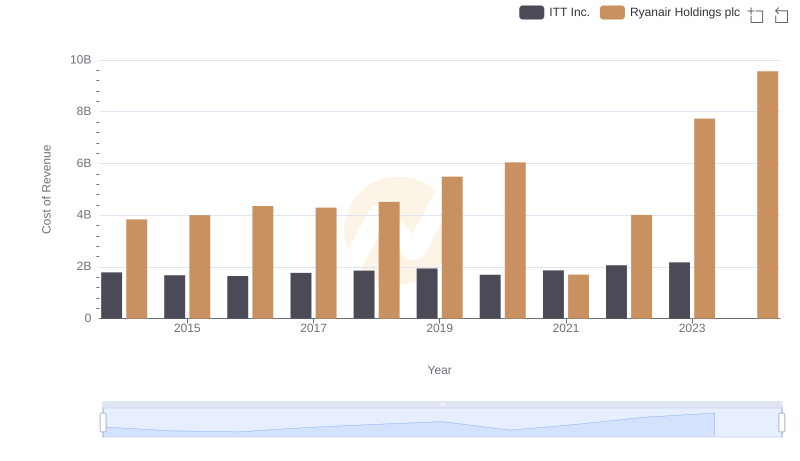
Analyzing Cost of Revenue: Ryanair Holdings plc and ITT Inc.
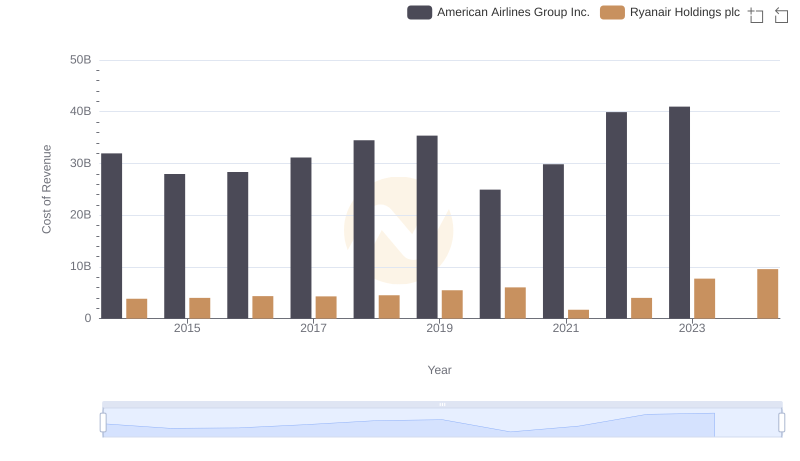
Cost of Revenue Comparison: Ryanair Holdings plc vs American Airlines Group Inc.

Ryanair Holdings plc vs Rentokil Initial plc: SG&A Expense Trends