| __timestamp | American Airlines Group Inc. | Rockwell Automation, Inc. |
|---|---|---|
| Wednesday, January 1, 2014 | 1544000000 | 1570100000 |
| Thursday, January 1, 2015 | 1394000000 | 1506400000 |
| Friday, January 1, 2016 | 1323000000 | 1467400000 |
| Sunday, January 1, 2017 | 1477000000 | 1591500000 |
| Monday, January 1, 2018 | 1520000000 | 1599000000 |
| Tuesday, January 1, 2019 | 1602000000 | 1538500000 |
| Wednesday, January 1, 2020 | 513000000 | 1479800000 |
| Friday, January 1, 2021 | 1098000000 | 1680000000 |
| Saturday, January 1, 2022 | 1815000000 | 1766700000 |
| Sunday, January 1, 2023 | 1799000000 | 2023700000 |
| Monday, January 1, 2024 | 2002600000 |
Unleashing the power of data
In the ever-evolving landscape of corporate finance, understanding the trends in Selling, General, and Administrative (SG&A) expenses is crucial for investors and analysts alike. Over the past decade, Rockwell Automation, Inc. and American Airlines Group Inc. have showcased distinct trajectories in their SG&A expenses.
From 2014 to 2023, Rockwell Automation's SG&A expenses have seen a steady increase, peaking in 2023 with a 29% rise from 2014. In contrast, American Airlines experienced a more volatile pattern, with a significant dip in 2020, likely due to the pandemic's impact, followed by a robust recovery, culminating in a 17% increase by 2023 compared to 2014.
These trends highlight the resilience and strategic adjustments of these companies in response to global economic shifts. Investors should consider these patterns when evaluating potential growth and stability in these sectors.

Who Optimizes SG&A Costs Better? Rockwell Automation, Inc. or Stanley Black & Decker, Inc.
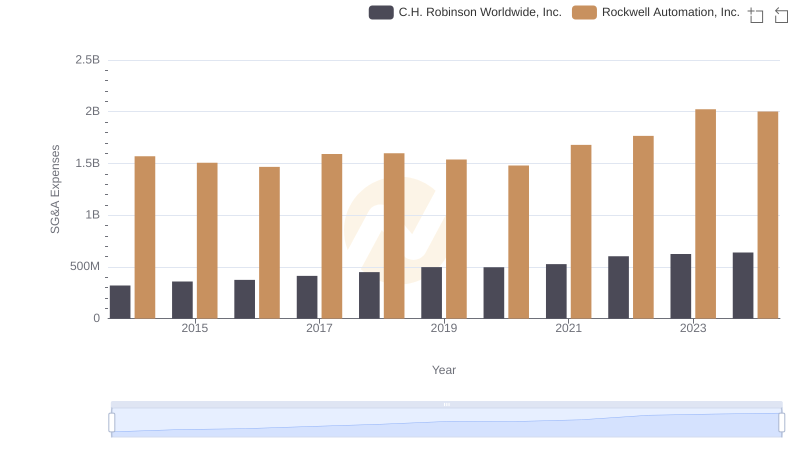
Cost Management Insights: SG&A Expenses for Rockwell Automation, Inc. and C.H. Robinson Worldwide, Inc.
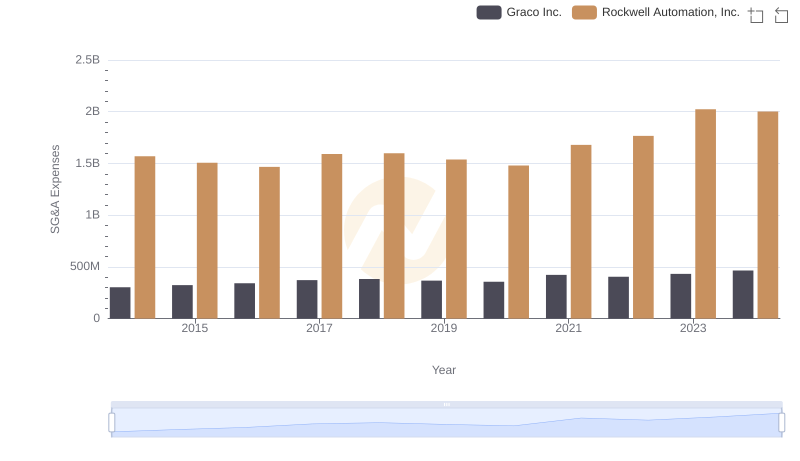
Rockwell Automation, Inc. and Graco Inc.: SG&A Spending Patterns Compared
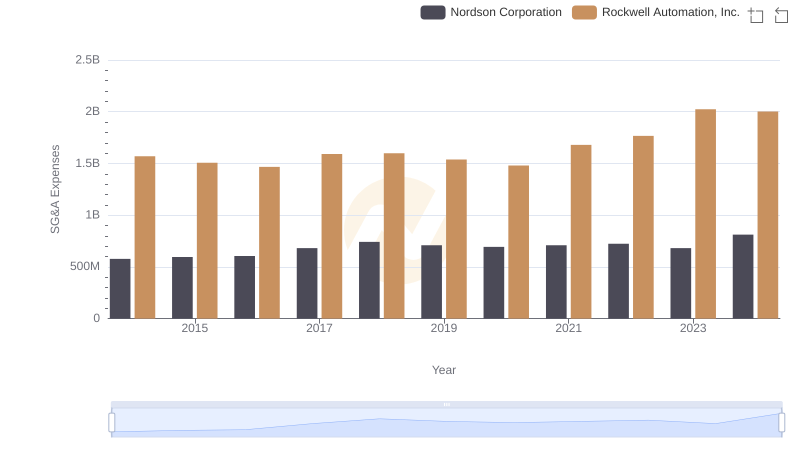
Selling, General, and Administrative Costs: Rockwell Automation, Inc. vs Nordson Corporation
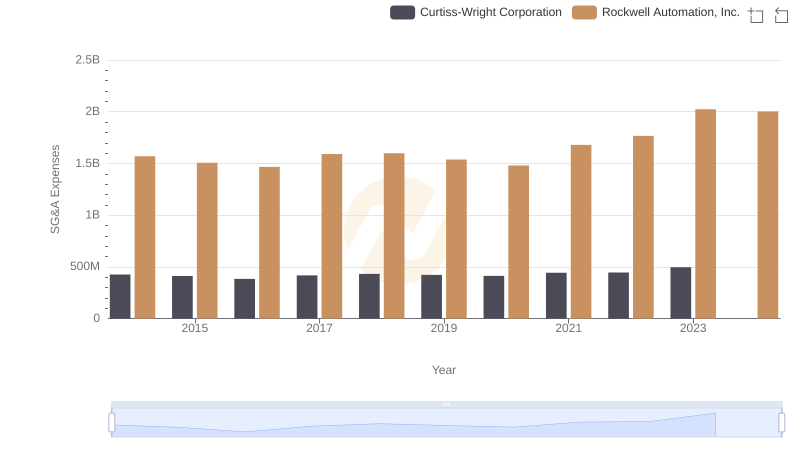
Comparing SG&A Expenses: Rockwell Automation, Inc. vs Curtiss-Wright Corporation Trends and Insights
Cost Insights: Breaking Down Rockwell Automation, Inc. and American Airlines Group Inc.'s Expenses
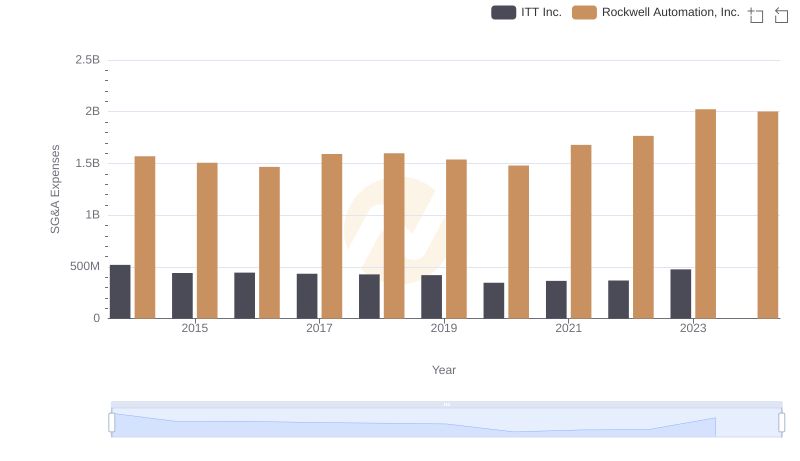
Rockwell Automation, Inc. and ITT Inc.: SG&A Spending Patterns Compared
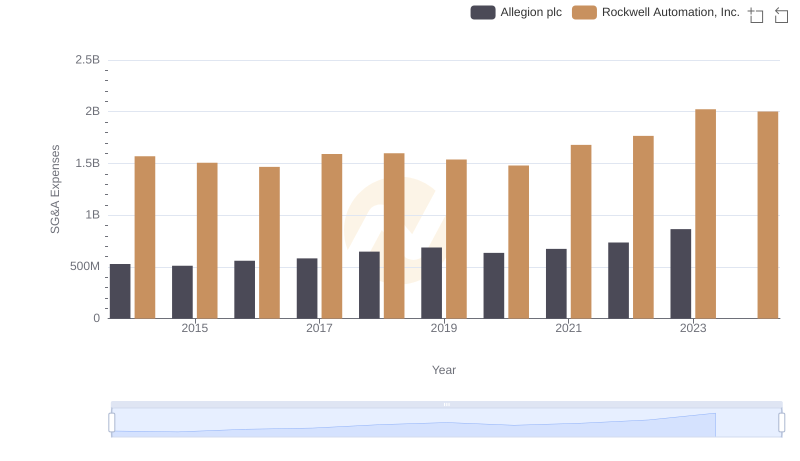
Breaking Down SG&A Expenses: Rockwell Automation, Inc. vs Allegion plc