| __timestamp | Pool Corporation | Waste Connections, Inc. |
|---|---|---|
| Wednesday, January 1, 2014 | 2246562000 | 2079166000 |
| Thursday, January 1, 2015 | 2363139000 | 2117287000 |
| Friday, January 1, 2016 | 2570803000 | 3375863000 |
| Sunday, January 1, 2017 | 2788188000 | 4630488000 |
| Monday, January 1, 2018 | 2998097000 | 4922941000 |
| Tuesday, January 1, 2019 | 3199517000 | 5388679000 |
| Wednesday, January 1, 2020 | 3936623000 | 5445990000 |
| Friday, January 1, 2021 | 5295584000 | 6151361000 |
| Saturday, January 1, 2022 | 6179727000 | 7211859000 |
| Sunday, January 1, 2023 | 5541595000 | 8021951000 |
| Monday, January 1, 2024 | 8919591000 |
Unveiling the hidden dimensions of data
In the past decade, Waste Connections, Inc. and Pool Corporation have demonstrated remarkable revenue growth, reflecting their strategic market positioning. Waste Connections, Inc. has seen its revenue soar by approximately 286% from 2014 to 2023, highlighting its robust expansion in the waste management sector. Meanwhile, Pool Corporation, a leader in the pool supply industry, experienced a 147% increase in revenue over the same period, underscoring its resilience and adaptability in a competitive market.
These trends reflect broader industry dynamics, with Waste Connections capitalizing on environmental regulations and Pool Corporation benefiting from increased home leisure investments.
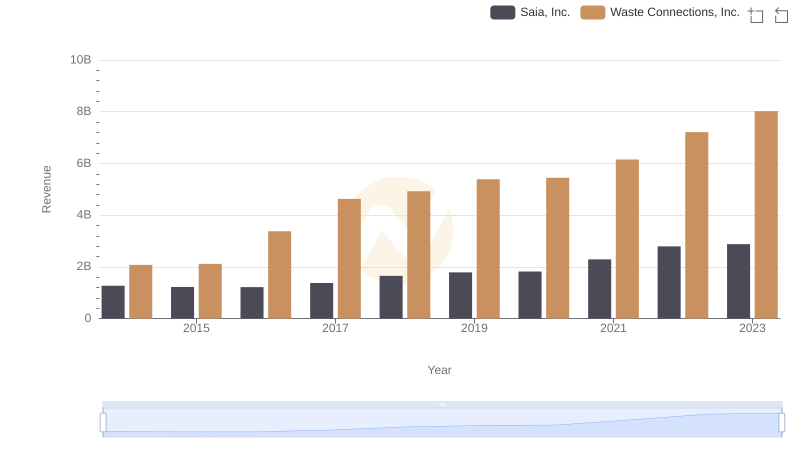
Comparing Revenue Performance: Waste Connections, Inc. or Saia, Inc.?
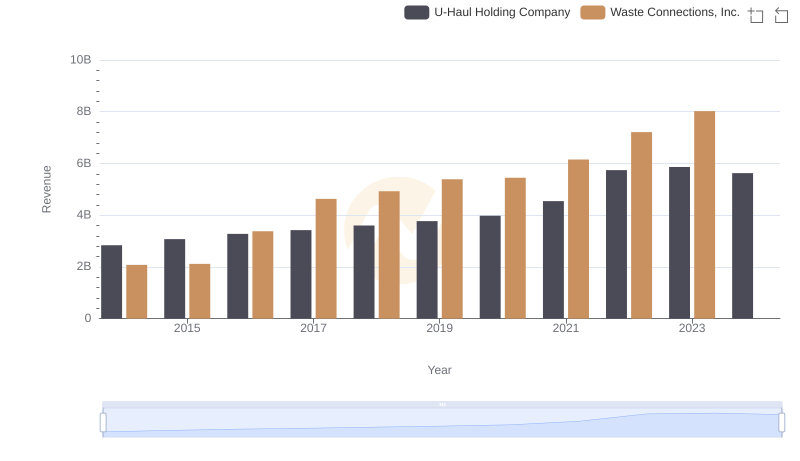
Comparing Revenue Performance: Waste Connections, Inc. or U-Haul Holding Company?
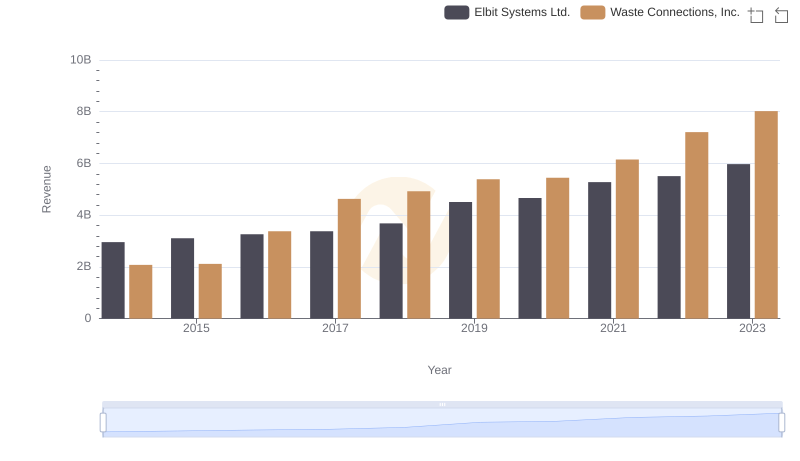
Revenue Showdown: Waste Connections, Inc. vs Elbit Systems Ltd.
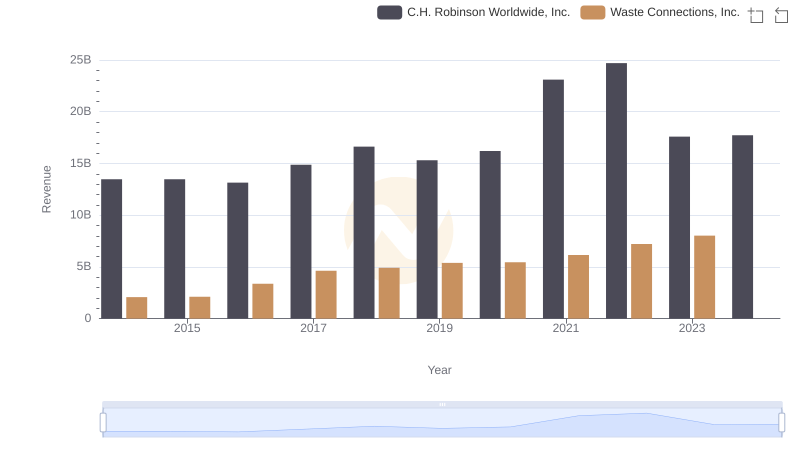
Revenue Insights: Waste Connections, Inc. and C.H. Robinson Worldwide, Inc. Performance Compared
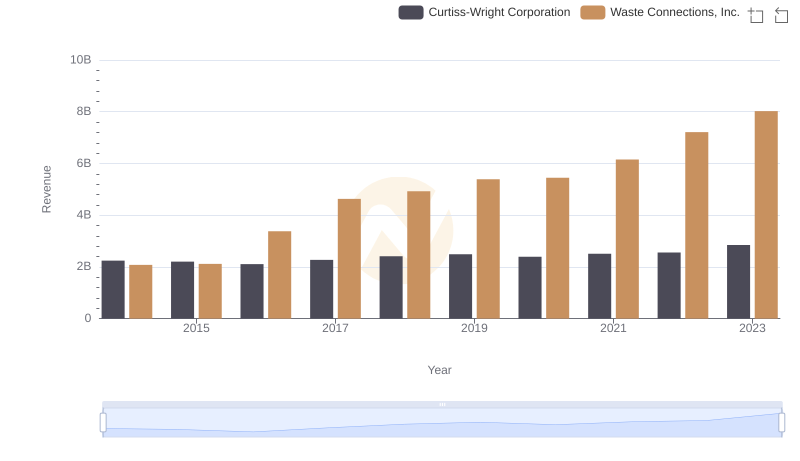
Annual Revenue Comparison: Waste Connections, Inc. vs Curtiss-Wright Corporation
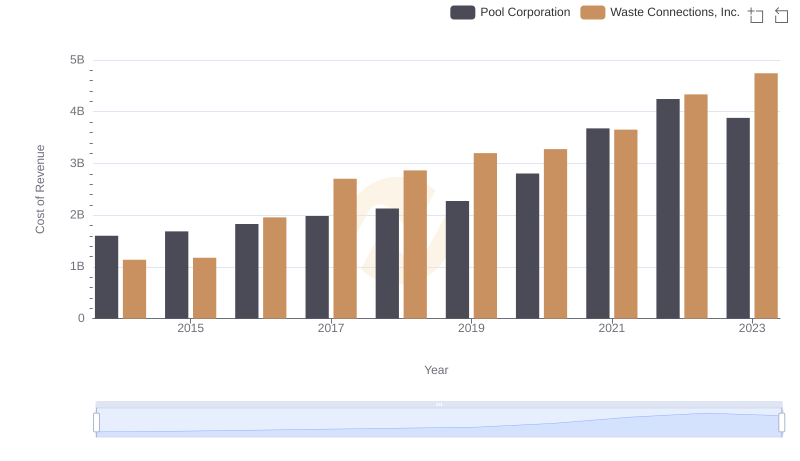
Waste Connections, Inc. vs Pool Corporation: Efficiency in Cost of Revenue Explored

Key Insights on Gross Profit: Waste Connections, Inc. vs Pool Corporation
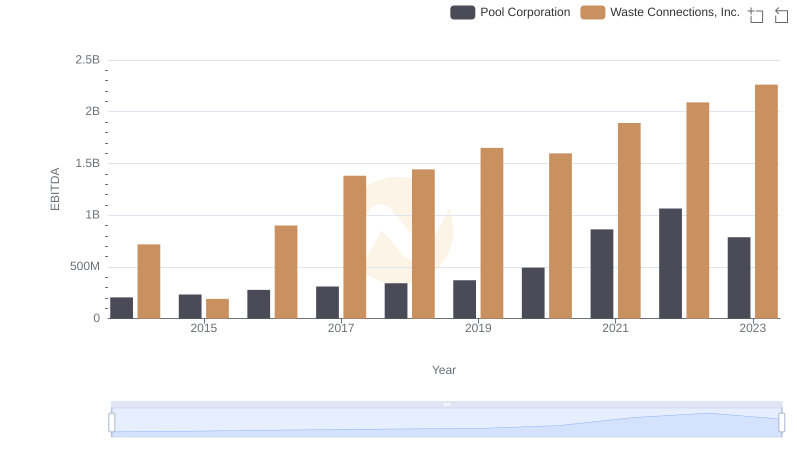
A Professional Review of EBITDA: Waste Connections, Inc. Compared to Pool Corporation