| __timestamp | Avery Dennison Corporation | Waste Connections, Inc. |
|---|---|---|
| Wednesday, January 1, 2014 | 6330300000 | 2079166000 |
| Thursday, January 1, 2015 | 5966900000 | 2117287000 |
| Friday, January 1, 2016 | 6086500000 | 3375863000 |
| Sunday, January 1, 2017 | 6613800000 | 4630488000 |
| Monday, January 1, 2018 | 7159000000 | 4922941000 |
| Tuesday, January 1, 2019 | 7070100000 | 5388679000 |
| Wednesday, January 1, 2020 | 6971500000 | 5445990000 |
| Friday, January 1, 2021 | 8408300000 | 6151361000 |
| Saturday, January 1, 2022 | 9039300000 | 7211859000 |
| Sunday, January 1, 2023 | 8364299999 | 8021951000 |
| Monday, January 1, 2024 | 8755700000 | 8919591000 |
Igniting the spark of knowledge
In the ever-evolving landscape of corporate growth, Waste Connections, Inc. and Avery Dennison Corporation stand as intriguing case studies. Over the past decade, these two companies have showcased distinct trajectories in annual revenue growth.
From 2014 to 2023, Avery Dennison Corporation experienced a steady climb, with revenue peaking in 2022 at approximately 9% higher than its 2014 figures. However, 2023 saw a slight dip, bringing it back to 2017 levels. In contrast, Waste Connections, Inc. demonstrated a robust growth pattern, with its revenue nearly quadrupling from 2014 to 2023. This remarkable surge highlights Waste Connections' strategic expansions and market adaptability.
These trends underscore the dynamic nature of business growth, where strategic decisions and market conditions play pivotal roles. As we delve deeper into these insights, the contrasting paths of these industry leaders offer valuable lessons for investors and business strategists alike.
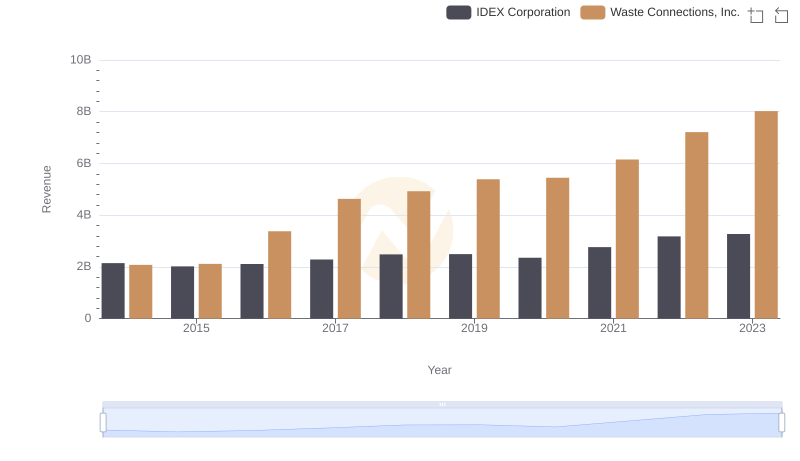
Revenue Insights: Waste Connections, Inc. and IDEX Corporation Performance Compared
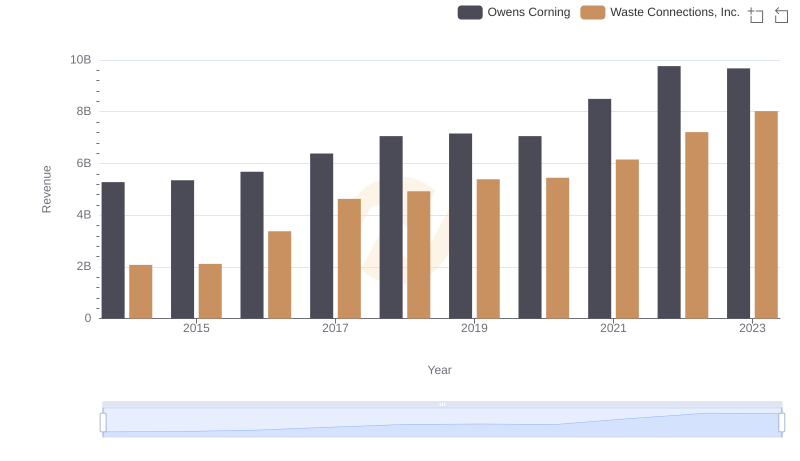
Comparing Revenue Performance: Waste Connections, Inc. or Owens Corning?
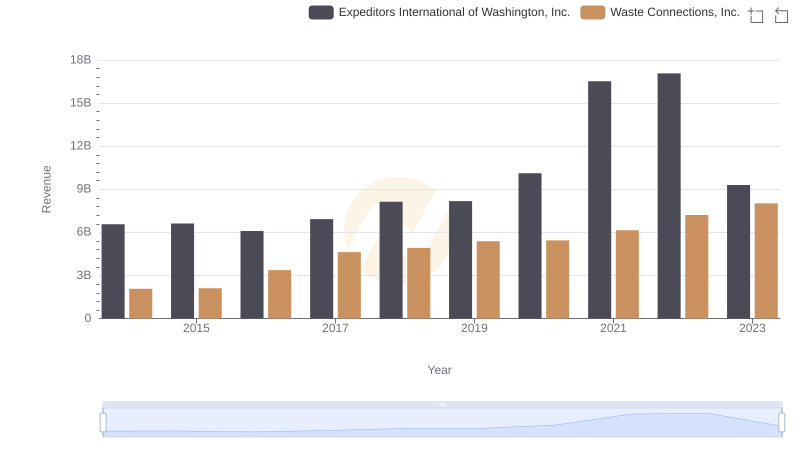
Waste Connections, Inc. or Expeditors International of Washington, Inc.: Who Leads in Yearly Revenue?
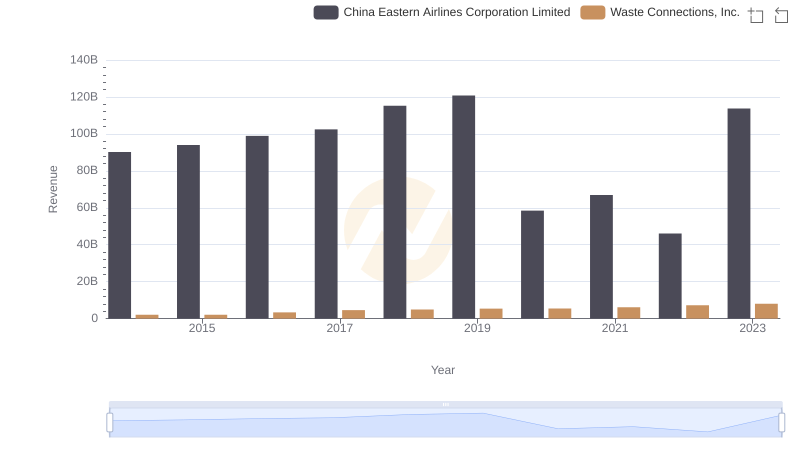
Revenue Insights: Waste Connections, Inc. and China Eastern Airlines Corporation Limited Performance Compared
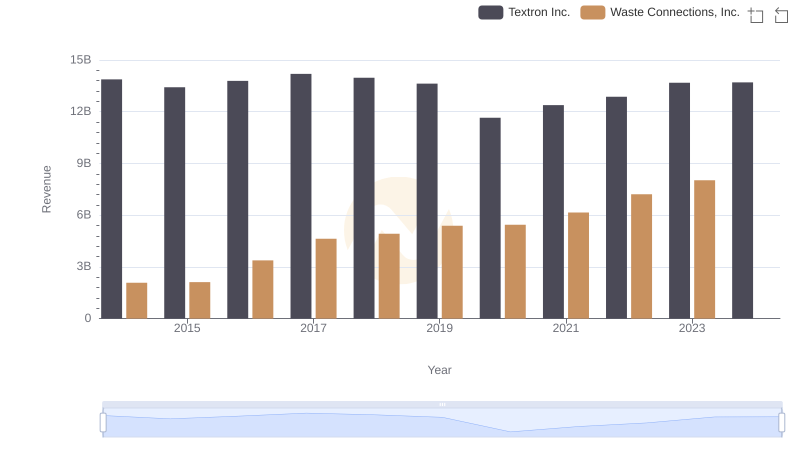
Waste Connections, Inc. and Textron Inc.: A Comprehensive Revenue Analysis
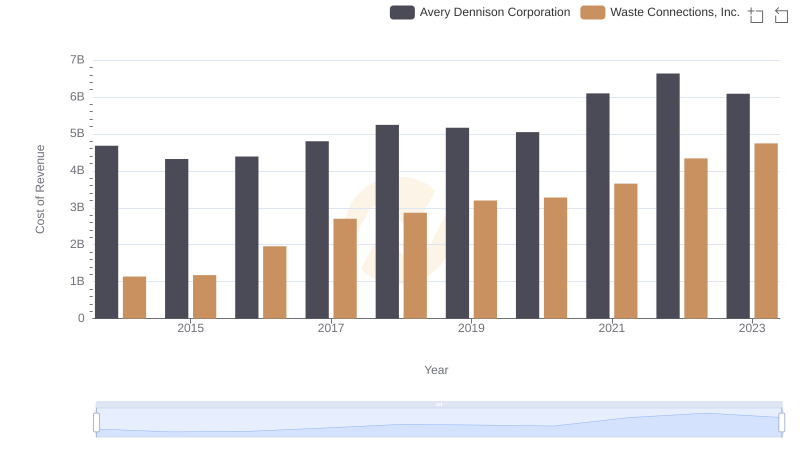
Cost Insights: Breaking Down Waste Connections, Inc. and Avery Dennison Corporation's Expenses
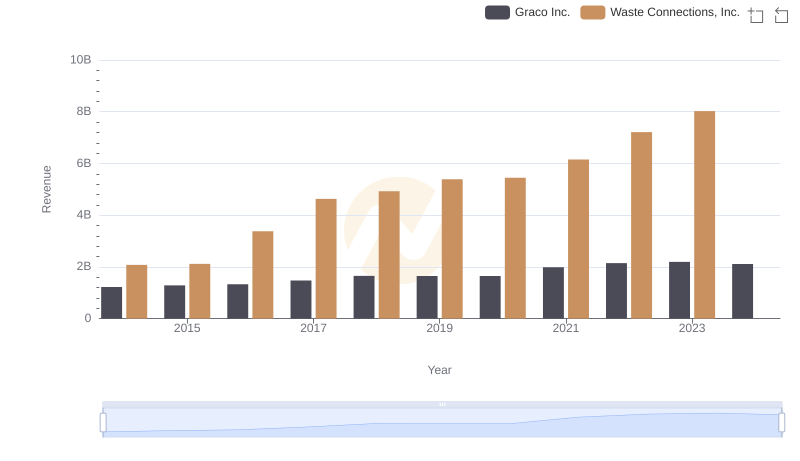
Annual Revenue Comparison: Waste Connections, Inc. vs Graco Inc.
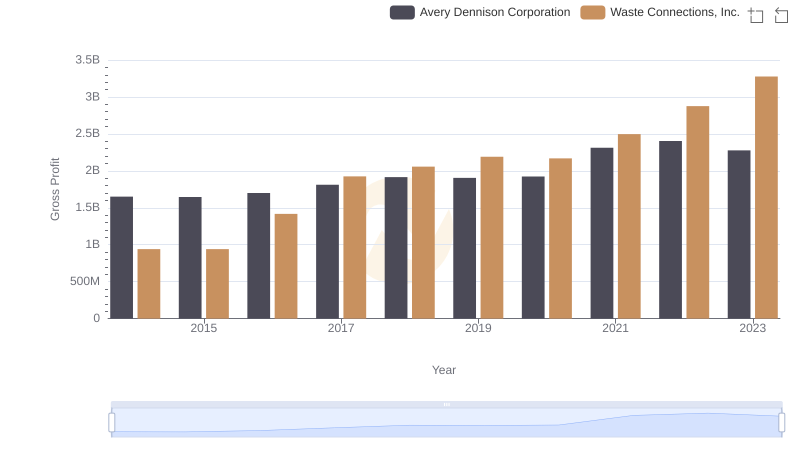
Gross Profit Comparison: Waste Connections, Inc. and Avery Dennison Corporation Trends
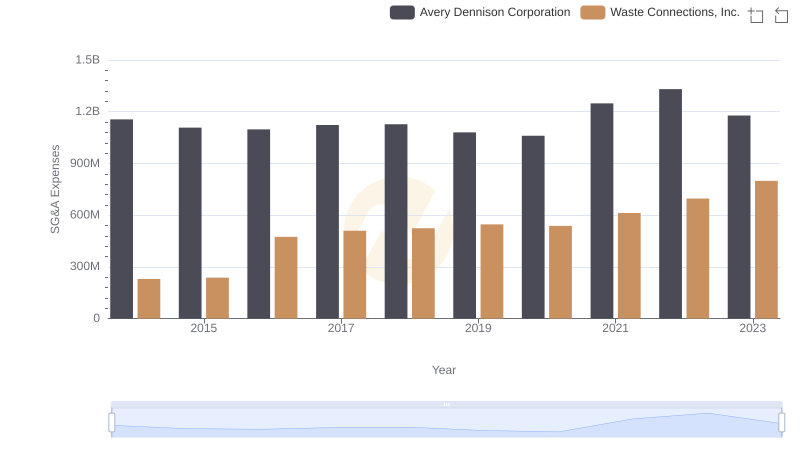
Breaking Down SG&A Expenses: Waste Connections, Inc. vs Avery Dennison Corporation