| __timestamp | Cintas Corporation | TFI International Inc. |
|---|---|---|
| Wednesday, January 1, 2014 | 4551812000 | 3199928501 |
| Thursday, January 1, 2015 | 4476886000 | 2904026835 |
| Friday, January 1, 2016 | 4905458000 | 2994723606 |
| Sunday, January 1, 2017 | 5323381000 | 3770194035 |
| Monday, January 1, 2018 | 6476632000 | 3761450188 |
| Tuesday, January 1, 2019 | 6892303000 | 3964619871 |
| Wednesday, January 1, 2020 | 7085120000 | 3781134000 |
| Friday, January 1, 2021 | 7116340000 | 7220429000 |
| Saturday, January 1, 2022 | 7854459000 | 8812491000 |
| Sunday, January 1, 2023 | 8815769000 | 7521167000 |
| Monday, January 1, 2024 | 9596615000 |
Data in motion
In the ever-evolving landscape of corporate growth, Cintas Corporation and TFI International Inc. stand as titans in their respective industries. Over the past decade, these companies have demonstrated remarkable revenue trajectories, reflecting their strategic prowess and market adaptability.
From 2014 to 2023, Cintas Corporation's revenue surged by approximately 111%, showcasing a consistent upward trend. This growth underscores Cintas's ability to innovate and expand its market reach. In contrast, TFI International Inc. experienced a revenue increase of around 135% from 2014 to 2022, with a notable peak in 2022. However, data for 2023 is missing, leaving a gap in the narrative of TFI's recent performance.
Cintas's steady growth trajectory highlights its resilience and strategic foresight, while TFI's rapid ascent, particularly in 2021 and 2022, reflects its aggressive expansion strategies. As we look to the future, these companies continue to set benchmarks in their industries, offering valuable insights into successful corporate growth strategies.
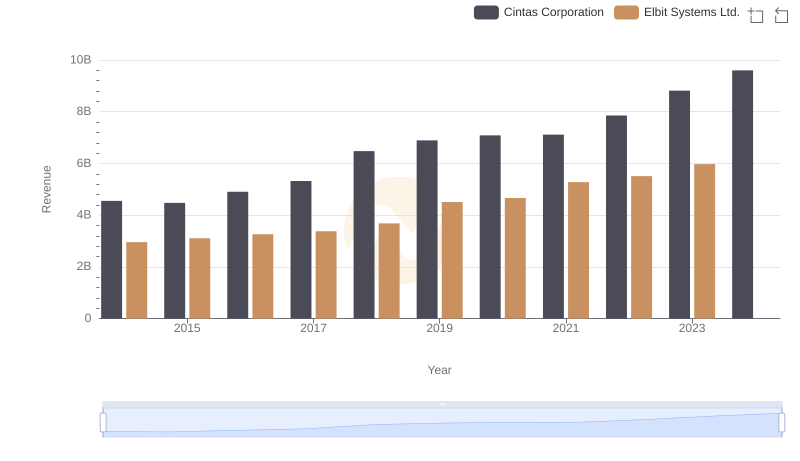
Who Generates More Revenue? Cintas Corporation or Elbit Systems Ltd.
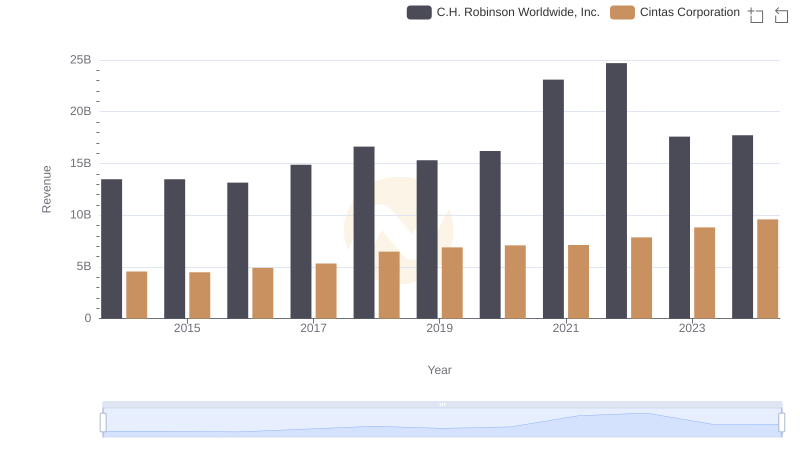
Revenue Showdown: Cintas Corporation vs C.H. Robinson Worldwide, Inc.
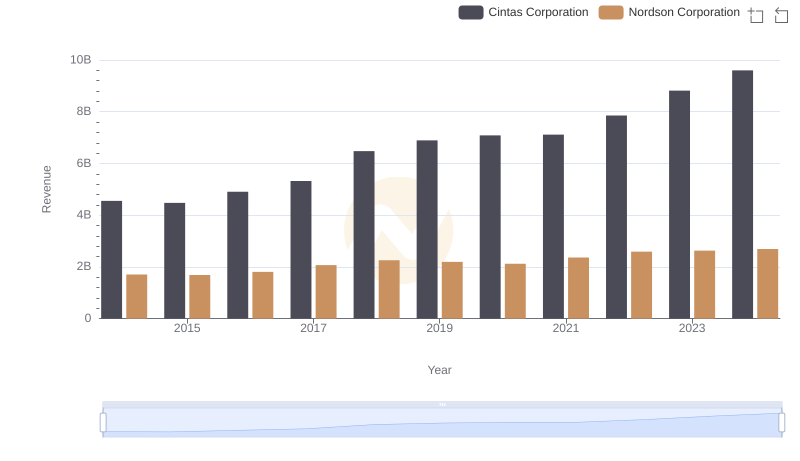
Cintas Corporation vs Nordson Corporation: Annual Revenue Growth Compared
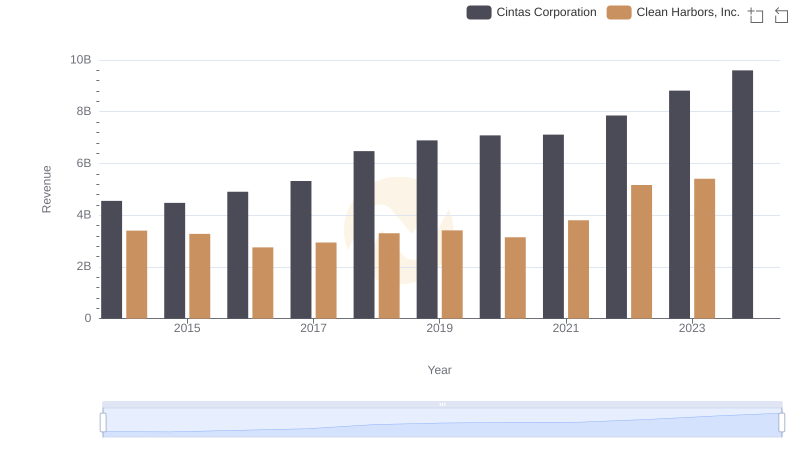
Revenue Insights: Cintas Corporation and Clean Harbors, Inc. Performance Compared
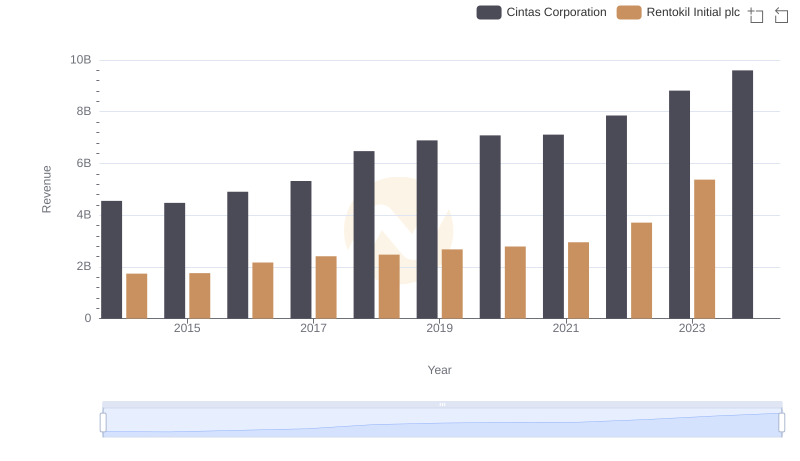
Cintas Corporation vs Rentokil Initial plc: Annual Revenue Growth Compared
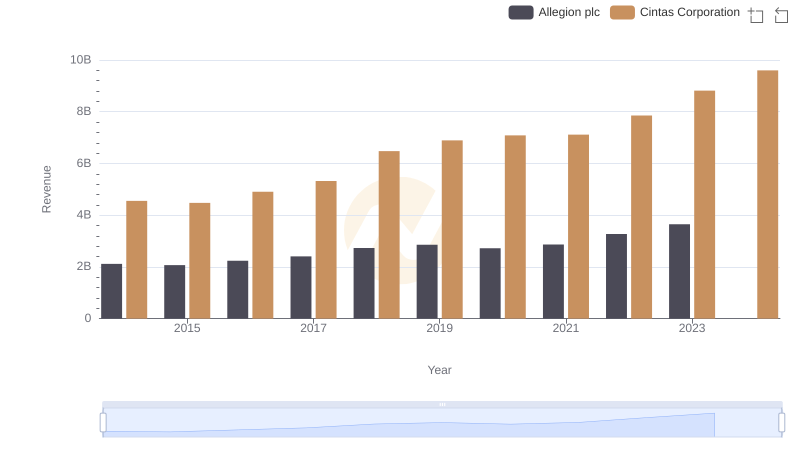
Annual Revenue Comparison: Cintas Corporation vs Allegion plc
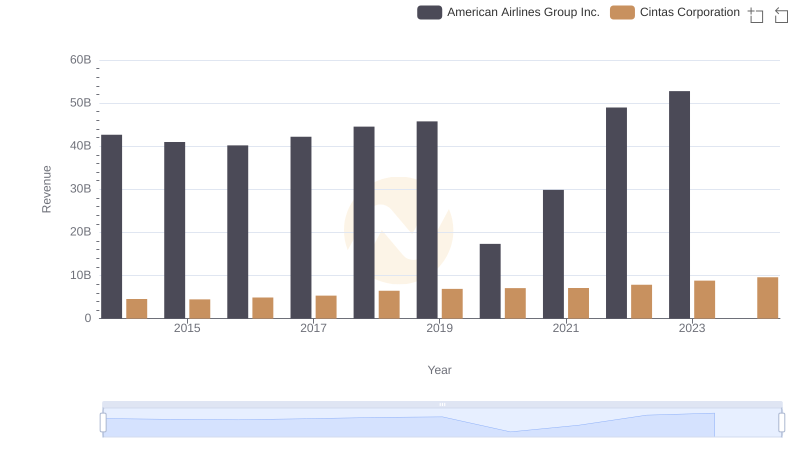
Revenue Showdown: Cintas Corporation vs American Airlines Group Inc.
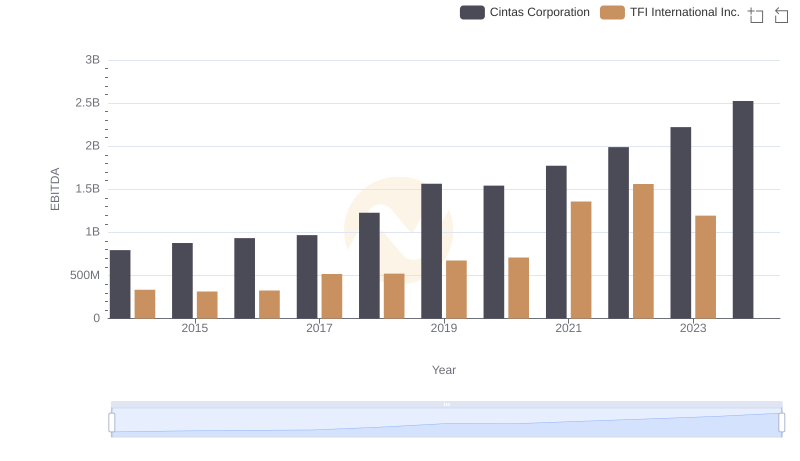
EBITDA Metrics Evaluated: Cintas Corporation vs TFI International Inc.