| __timestamp | AMETEK, Inc. | TFI International Inc. |
|---|---|---|
| Wednesday, January 1, 2014 | 4021964000 | 3199928501 |
| Thursday, January 1, 2015 | 3974295000 | 2904026835 |
| Friday, January 1, 2016 | 3840087000 | 2994723606 |
| Sunday, January 1, 2017 | 4300170000 | 3770194035 |
| Monday, January 1, 2018 | 4845872000 | 3761450188 |
| Tuesday, January 1, 2019 | 5158557000 | 3964619871 |
| Wednesday, January 1, 2020 | 4540029000 | 3781134000 |
| Friday, January 1, 2021 | 5546514000 | 7220429000 |
| Saturday, January 1, 2022 | 6150530000 | 8812491000 |
| Sunday, January 1, 2023 | 6596950000 | 7521167000 |
| Monday, January 1, 2024 | 6941180000 |
Unleashing the power of data
In the ever-evolving landscape of industrial and transportation sectors, AMETEK, Inc. and TFI International Inc. have emerged as formidable players. Over the past decade, these companies have demonstrated remarkable revenue growth, reflecting their strategic prowess and market adaptability.
AMETEK, Inc. has seen its revenue grow by approximately 64% from 2014 to 2023, showcasing a steady upward trajectory. Notably, the company experienced a significant surge in 2022, with revenues peaking at $6.6 billion in 2023. This growth underscores AMETEK's resilience and ability to capitalize on market opportunities.
Conversely, TFI International Inc. has exhibited a more volatile revenue pattern, with a staggering 176% increase from 2014 to 2022. The year 2021 marked a pivotal point, with revenues soaring to $7.2 billion, followed by a peak of $8.8 billion in 2022. This impressive growth trajectory highlights TFI's strategic acquisitions and expansion efforts.
Both companies have navigated economic challenges and leveraged their strengths to achieve substantial revenue gains, making them key players to watch in their respective industries.
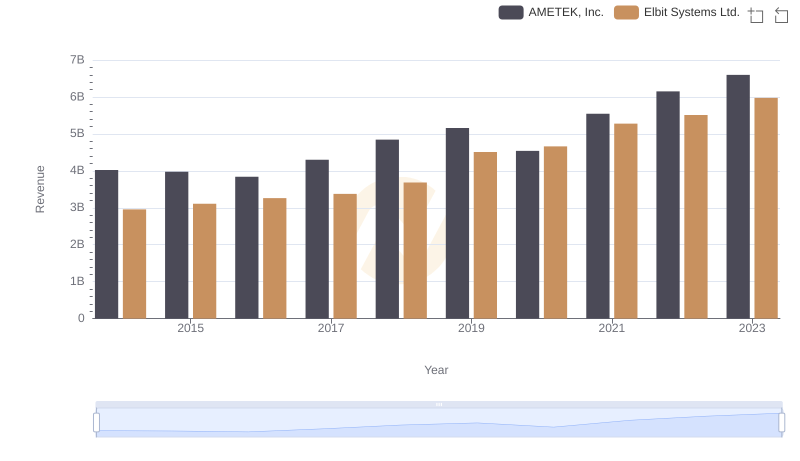
Revenue Insights: AMETEK, Inc. and Elbit Systems Ltd. Performance Compared
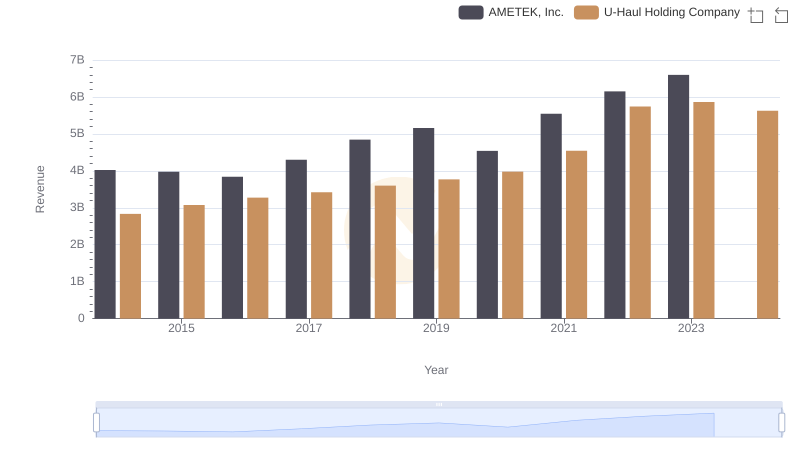
AMETEK, Inc. vs U-Haul Holding Company: Annual Revenue Growth Compared
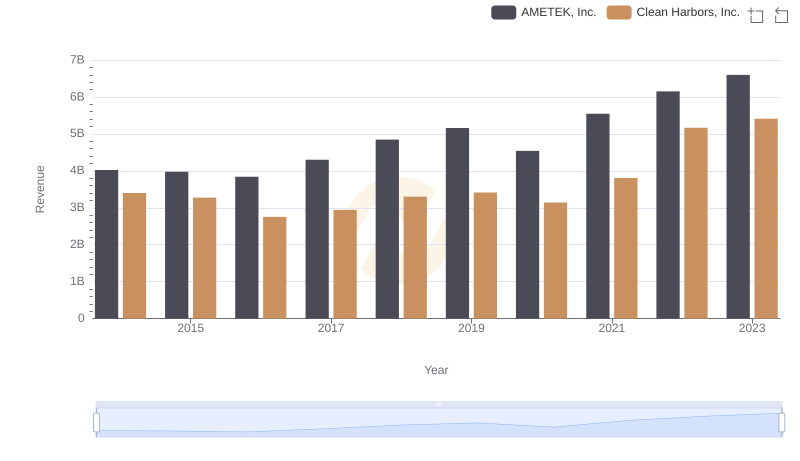
Revenue Showdown: AMETEK, Inc. vs Clean Harbors, Inc.
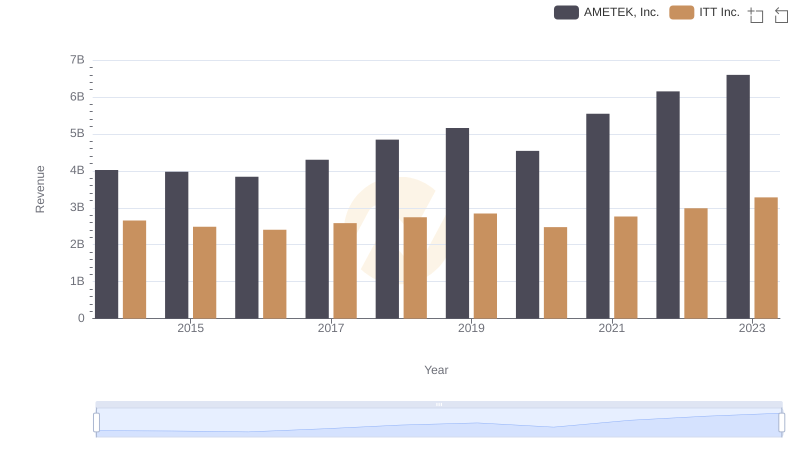
AMETEK, Inc. or ITT Inc.: Who Leads in Yearly Revenue?
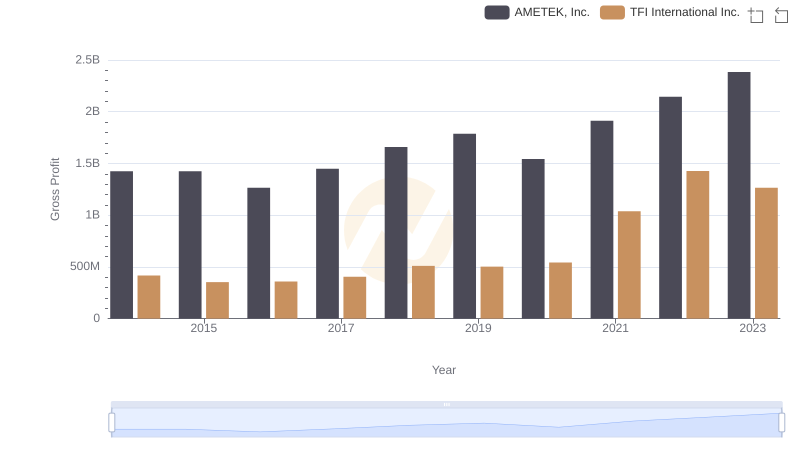
Gross Profit Trends Compared: AMETEK, Inc. vs TFI International Inc.