| __timestamp | American Airlines Group Inc. | Waste Connections, Inc. |
|---|---|---|
| Wednesday, January 1, 2014 | 42650000000 | 2079166000 |
| Thursday, January 1, 2015 | 40990000000 | 2117287000 |
| Friday, January 1, 2016 | 40180000000 | 3375863000 |
| Sunday, January 1, 2017 | 42207000000 | 4630488000 |
| Monday, January 1, 2018 | 44541000000 | 4922941000 |
| Tuesday, January 1, 2019 | 45768000000 | 5388679000 |
| Wednesday, January 1, 2020 | 17337000000 | 5445990000 |
| Friday, January 1, 2021 | 29882000000 | 6151361000 |
| Saturday, January 1, 2022 | 48971000000 | 7211859000 |
| Sunday, January 1, 2023 | 52788000000 | 8021951000 |
| Monday, January 1, 2024 | 8919591000 |
Unleashing insights
In the ever-evolving landscape of American business, Waste Connections, Inc. and American Airlines Group Inc. offer a fascinating study in contrasts. Over the past decade, these two giants have navigated their respective industries with varying degrees of success.
From 2014 to 2023, American Airlines experienced a rollercoaster of revenue changes. The airline's revenue peaked in 2023, showing a remarkable recovery with a 204% increase from its pandemic low in 2020. This resurgence underscores the airline industry's resilience and adaptability in the face of global challenges.
Meanwhile, Waste Connections, Inc. has steadily climbed the revenue ladder, achieving a 286% growth from 2014 to 2023. This consistent upward trend highlights the waste management sector's stability and essential role in modern society.
Both companies exemplify the diverse dynamics of American industry, each thriving in its unique way.
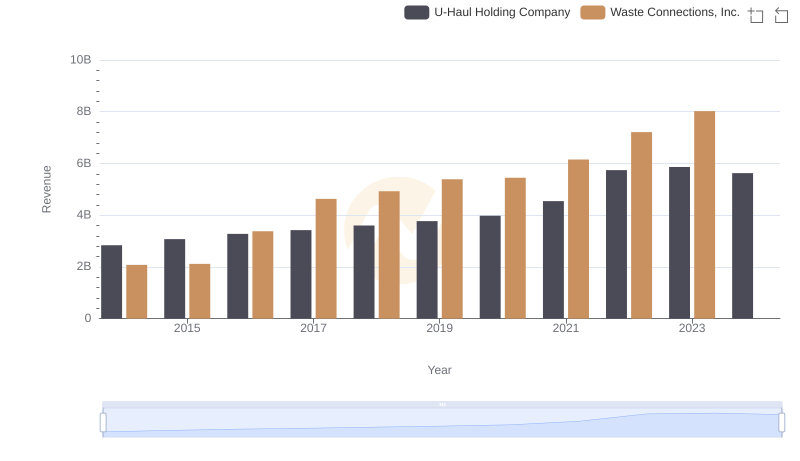
Comparing Revenue Performance: Waste Connections, Inc. or U-Haul Holding Company?
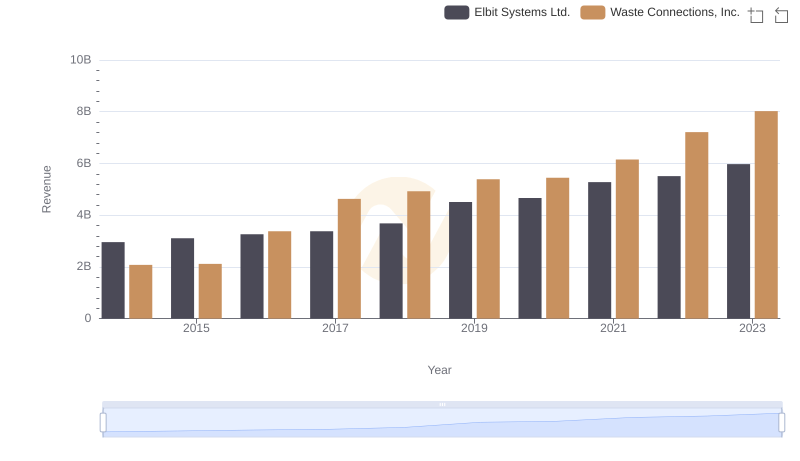
Revenue Showdown: Waste Connections, Inc. vs Elbit Systems Ltd.
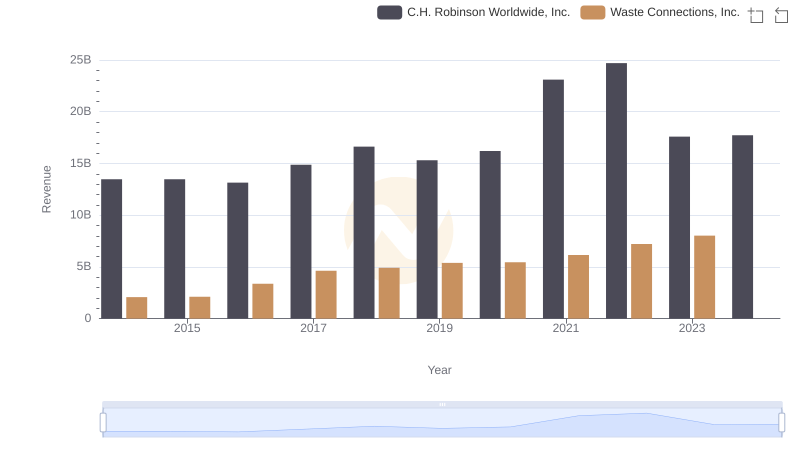
Revenue Insights: Waste Connections, Inc. and C.H. Robinson Worldwide, Inc. Performance Compared
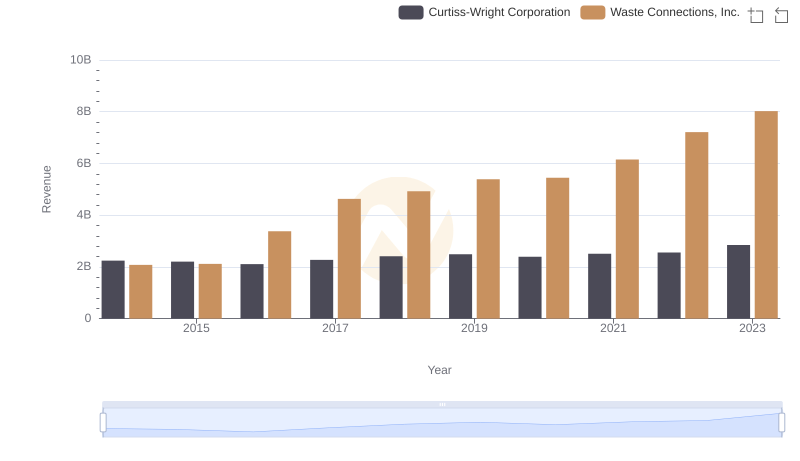
Annual Revenue Comparison: Waste Connections, Inc. vs Curtiss-Wright Corporation
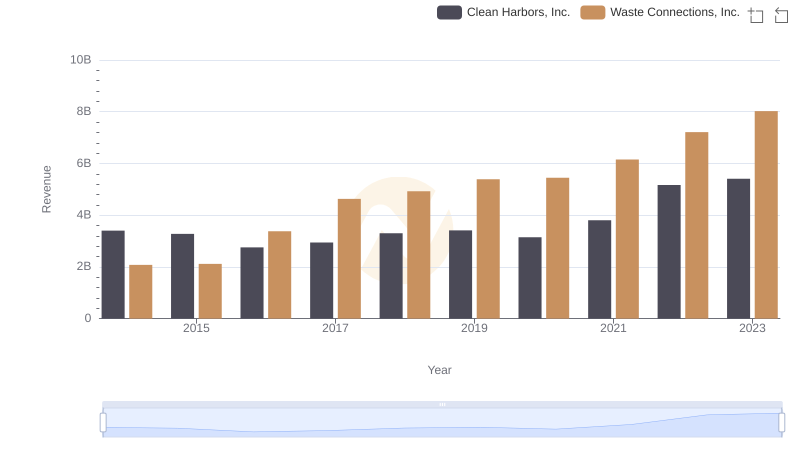
Waste Connections, Inc. or Clean Harbors, Inc.: Who Leads in Yearly Revenue?
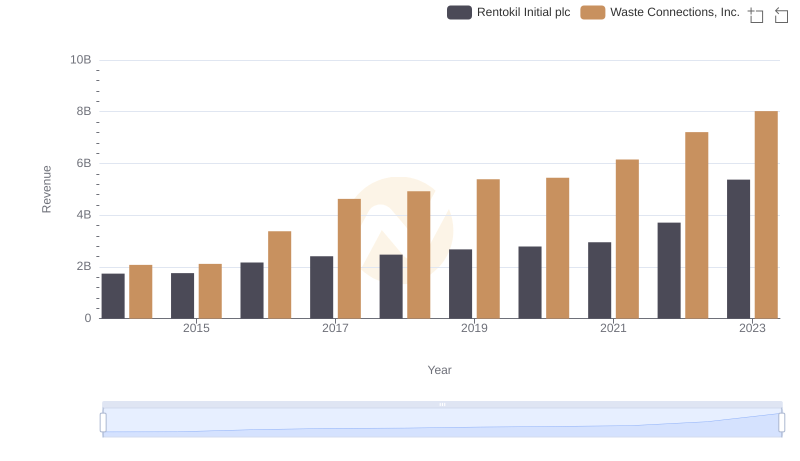
Revenue Insights: Waste Connections, Inc. and Rentokil Initial plc Performance Compared
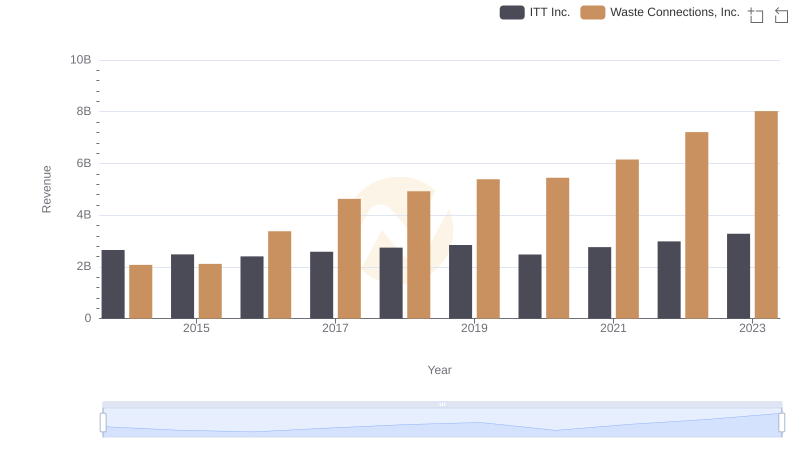
Revenue Showdown: Waste Connections, Inc. vs ITT Inc.
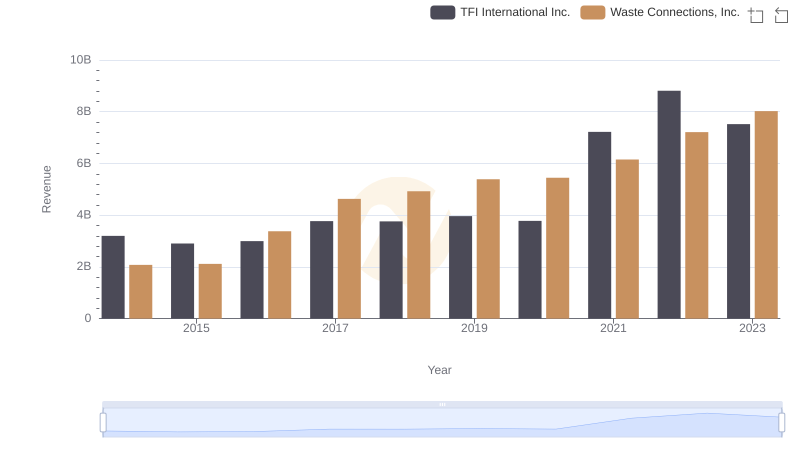
Waste Connections, Inc. or TFI International Inc.: Who Leads in Yearly Revenue?
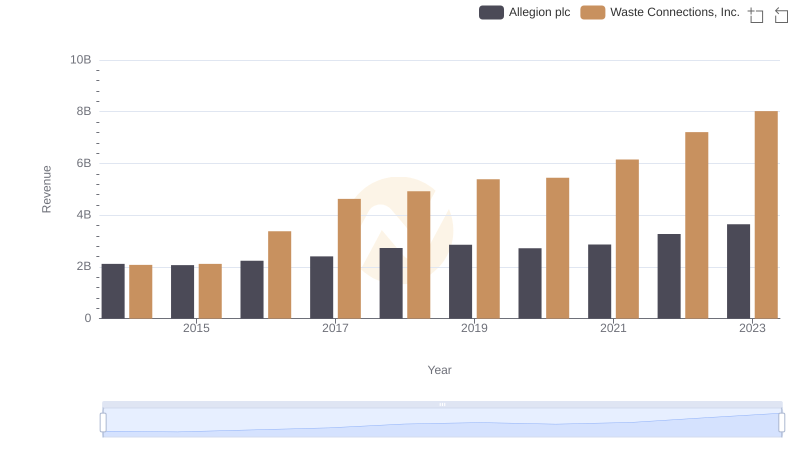
Revenue Showdown: Waste Connections, Inc. vs Allegion plc
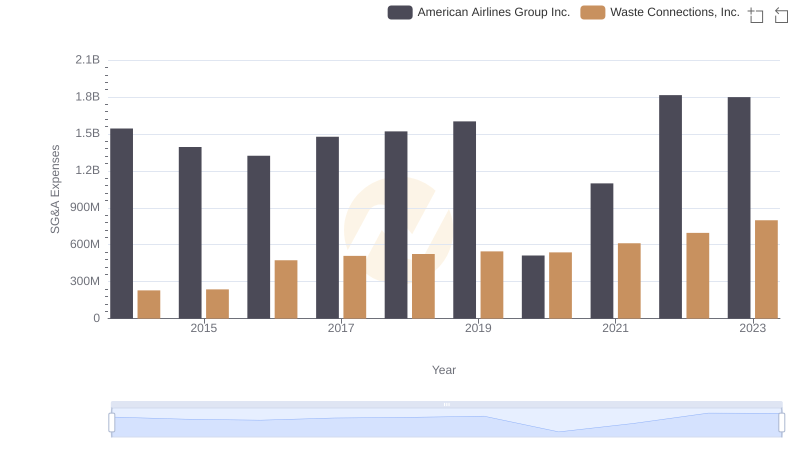
SG&A Efficiency Analysis: Comparing Waste Connections, Inc. and American Airlines Group Inc.