| __timestamp | Ingersoll Rand Inc. | Masco Corporation |
|---|---|---|
| Wednesday, January 1, 2014 | 2570005000 | 8521000000 |
| Thursday, January 1, 2015 | 2126900000 | 7142000000 |
| Friday, January 1, 2016 | 1939436000 | 7357000000 |
| Sunday, January 1, 2017 | 2375400000 | 7644000000 |
| Monday, January 1, 2018 | 2689800000 | 8359000000 |
| Tuesday, January 1, 2019 | 2451900000 | 6707000000 |
| Wednesday, January 1, 2020 | 4910200000 | 7188000000 |
| Friday, January 1, 2021 | 5152400000 | 8375000000 |
| Saturday, January 1, 2022 | 5916300000 | 8680000000 |
| Sunday, January 1, 2023 | 6876100000 | 7967000000 |
| Monday, January 1, 2024 | 0 | 7828000000 |
Unleashing insights
In the ever-evolving landscape of industrial and home improvement sectors, Ingersoll Rand Inc. and Masco Corporation have showcased intriguing revenue trajectories over the past decade. From 2014 to 2023, Ingersoll Rand Inc. has experienced a remarkable growth of approximately 168%, with revenue surging from $2.57 billion to $6.88 billion. This growth highlights the company's strategic advancements and market adaptability. In contrast, Masco Corporation, a leader in home improvement products, has maintained a relatively stable revenue stream, peaking at $8.68 billion in 2022 before a slight dip to $7.97 billion in 2023. This stability underscores Masco's consistent market presence despite economic fluctuations. The data reveals a compelling narrative of growth and resilience, offering valuable insights for investors and industry analysts alike. Explore the chart to delve deeper into these financial dynamics and understand the factors driving these trends.
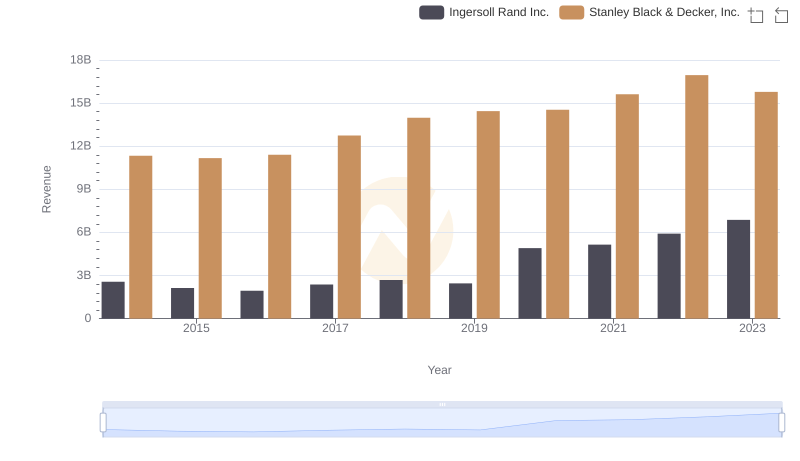
Ingersoll Rand Inc. and Stanley Black & Decker, Inc.: A Comprehensive Revenue Analysis
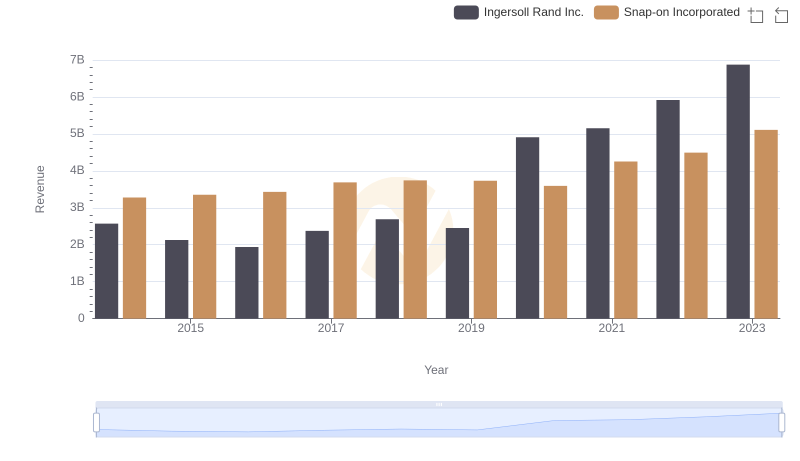
Ingersoll Rand Inc. vs Snap-on Incorporated: Examining Key Revenue Metrics
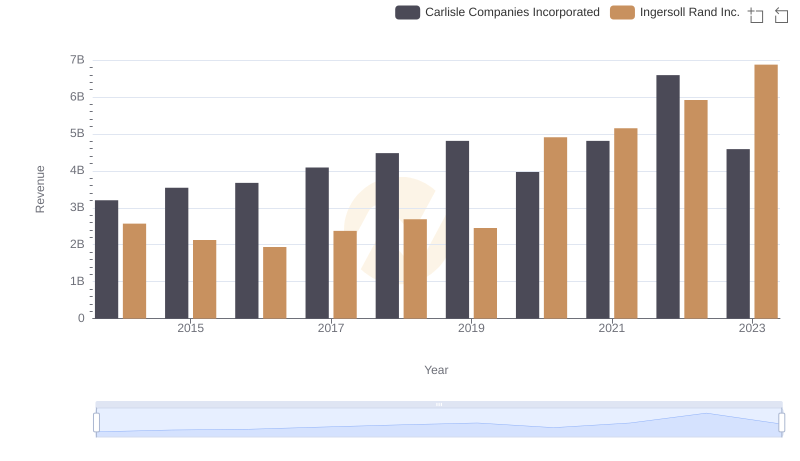
Ingersoll Rand Inc. vs Carlisle Companies Incorporated: Annual Revenue Growth Compared
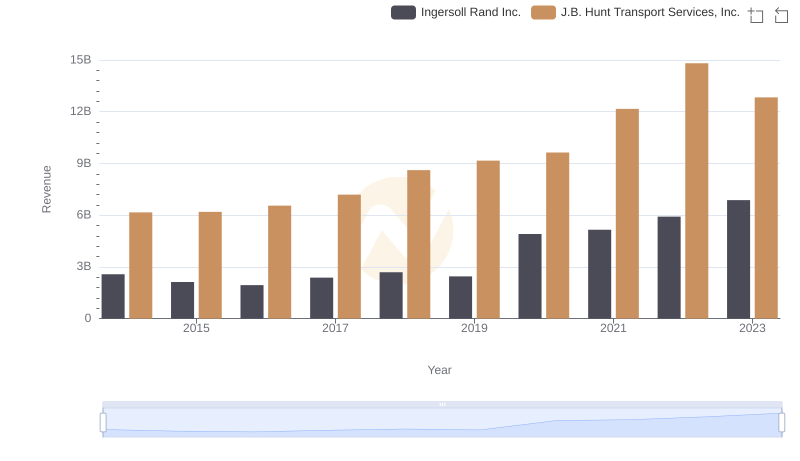
Comparing Revenue Performance: Ingersoll Rand Inc. or J.B. Hunt Transport Services, Inc.?
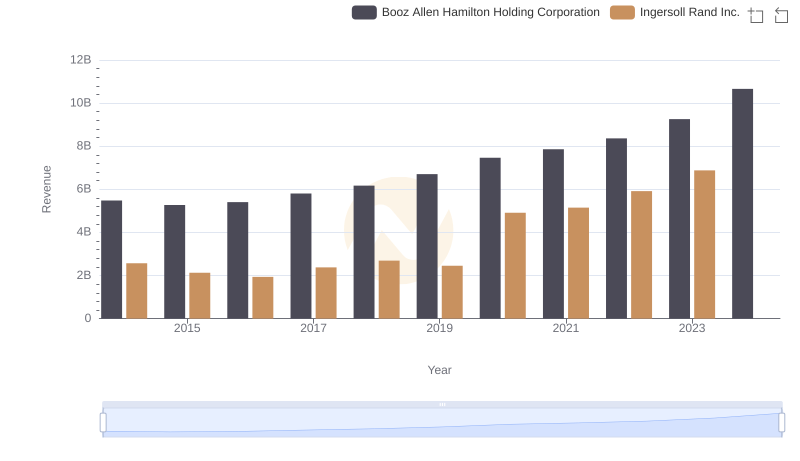
Revenue Insights: Ingersoll Rand Inc. and Booz Allen Hamilton Holding Corporation Performance Compared
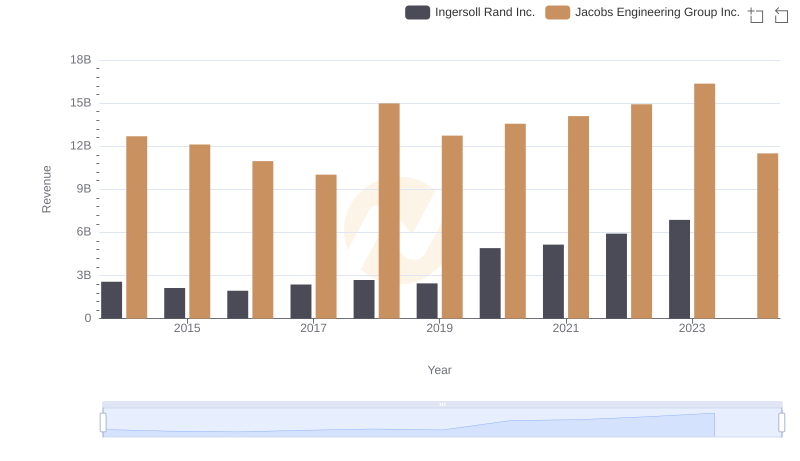
Ingersoll Rand Inc. and Jacobs Engineering Group Inc.: A Comprehensive Revenue Analysis
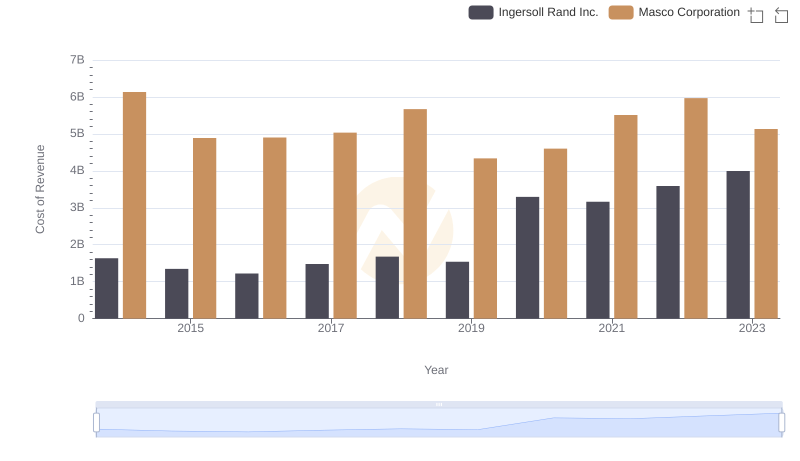
Cost of Revenue: Key Insights for Ingersoll Rand Inc. and Masco Corporation
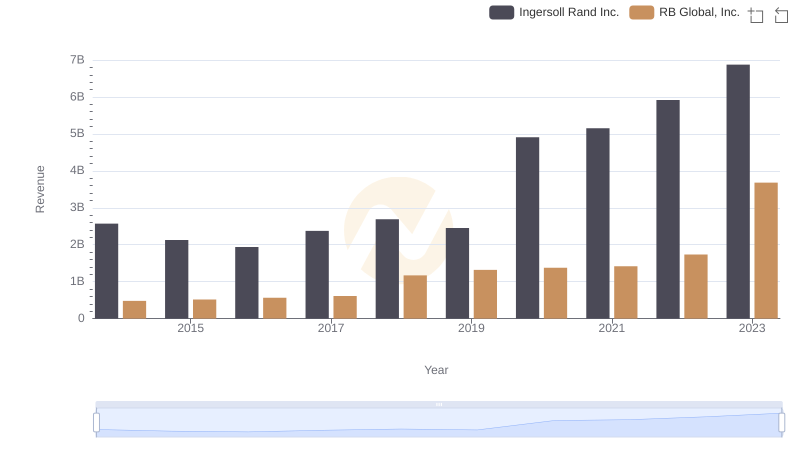
Breaking Down Revenue Trends: Ingersoll Rand Inc. vs RB Global, Inc.
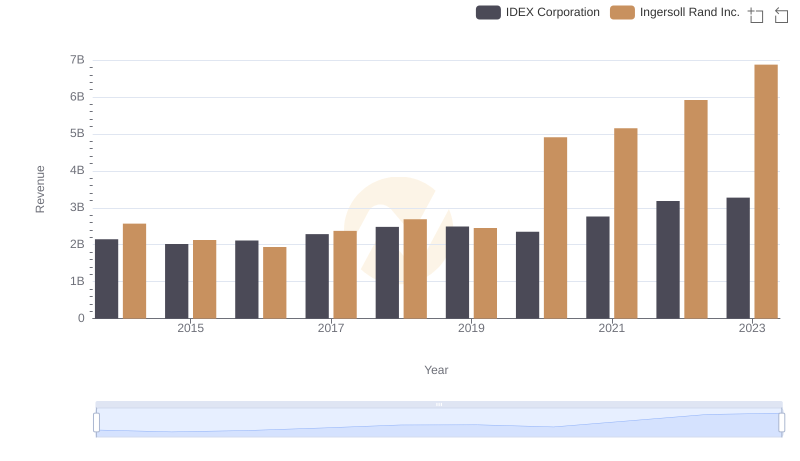
Ingersoll Rand Inc. vs IDEX Corporation: Annual Revenue Growth Compared
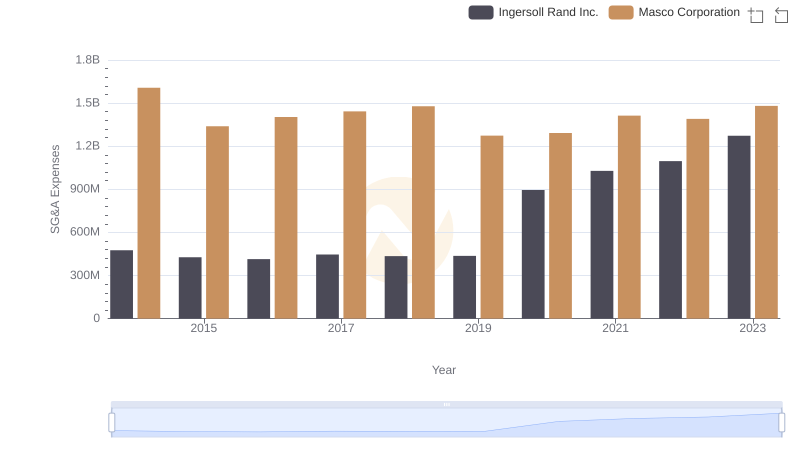
Ingersoll Rand Inc. or Masco Corporation: Who Manages SG&A Costs Better?