| __timestamp | Ingersoll Rand Inc. | Snap-on Incorporated |
|---|---|---|
| Wednesday, January 1, 2014 | 2570005000 | 3277700000 |
| Thursday, January 1, 2015 | 2126900000 | 3352800000 |
| Friday, January 1, 2016 | 1939436000 | 3430400000 |
| Sunday, January 1, 2017 | 2375400000 | 3686900000 |
| Monday, January 1, 2018 | 2689800000 | 3740700000 |
| Tuesday, January 1, 2019 | 2451900000 | 3730000000 |
| Wednesday, January 1, 2020 | 4910200000 | 3592500000 |
| Friday, January 1, 2021 | 5152400000 | 4252000000 |
| Saturday, January 1, 2022 | 5916300000 | 4492800000 |
| Sunday, January 1, 2023 | 6876100000 | 5108300000 |
| Monday, January 1, 2024 | 0 | 4707400000 |
Igniting the spark of knowledge
In the ever-evolving landscape of industrial manufacturing, Ingersoll Rand Inc. and Snap-on Incorporated have showcased intriguing revenue trajectories over the past decade. From 2014 to 2023, Ingersoll Rand's revenue surged by approximately 167%, reflecting a robust growth strategy and market adaptation. In contrast, Snap-on Incorporated experienced a more modest increase of around 56%, indicating steady yet less aggressive expansion.
This analysis highlights the contrasting growth strategies and market positions of these industrial giants.
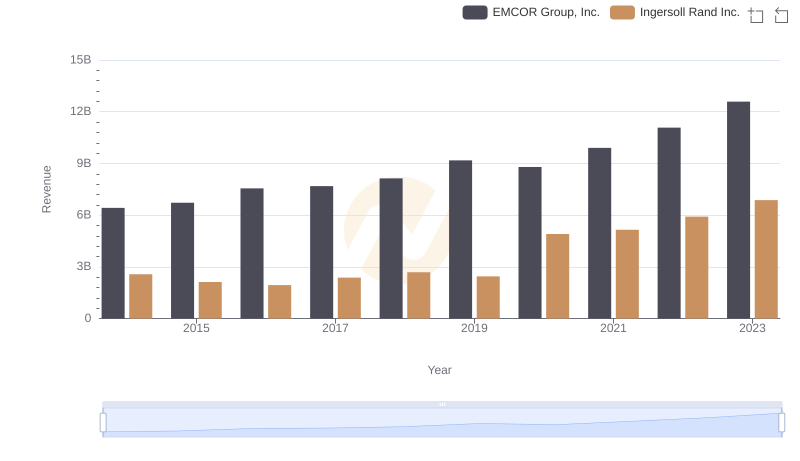
Breaking Down Revenue Trends: Ingersoll Rand Inc. vs EMCOR Group, Inc.
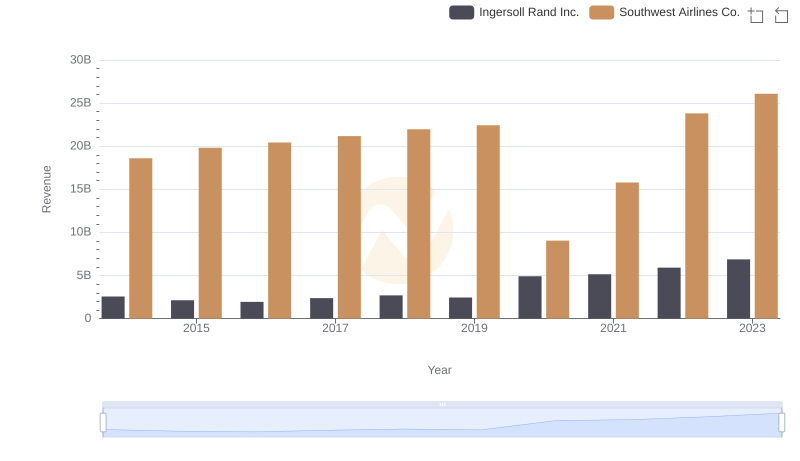
Ingersoll Rand Inc. vs Southwest Airlines Co.: Examining Key Revenue Metrics
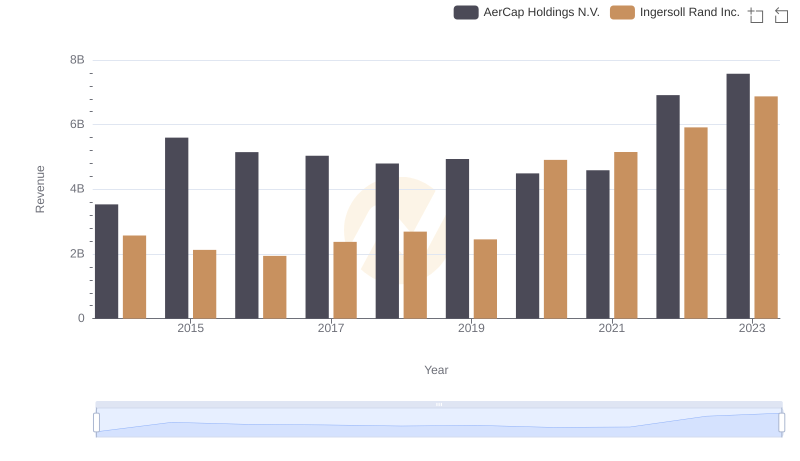
Revenue Insights: Ingersoll Rand Inc. and AerCap Holdings N.V. Performance Compared
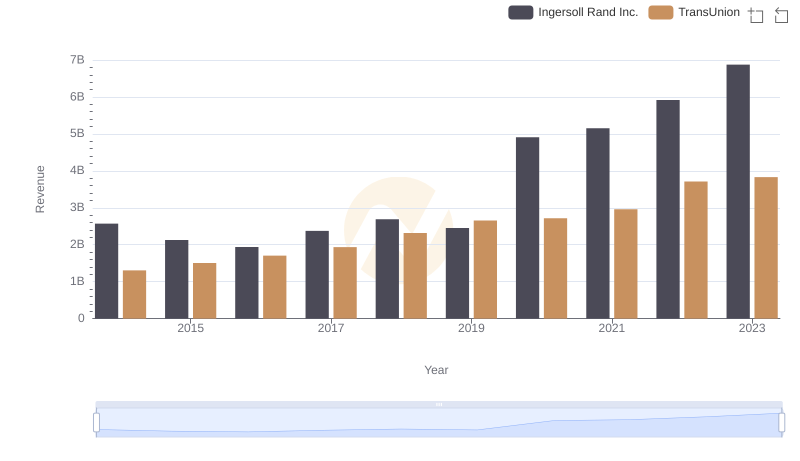
Ingersoll Rand Inc. vs TransUnion: Annual Revenue Growth Compared
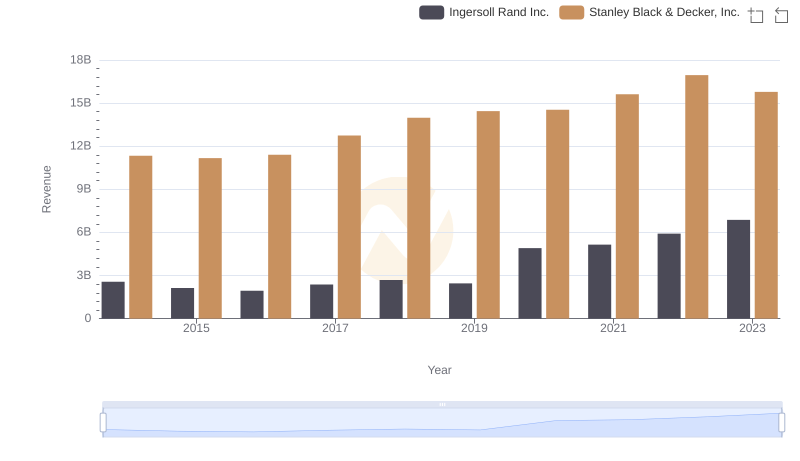
Ingersoll Rand Inc. and Stanley Black & Decker, Inc.: A Comprehensive Revenue Analysis
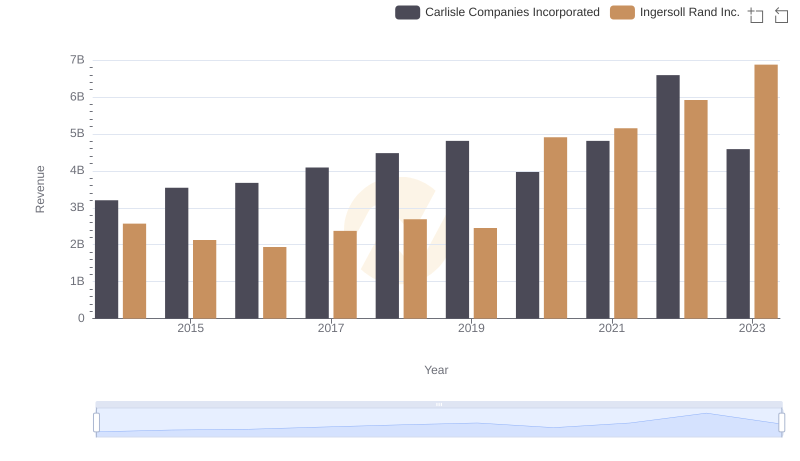
Ingersoll Rand Inc. vs Carlisle Companies Incorporated: Annual Revenue Growth Compared
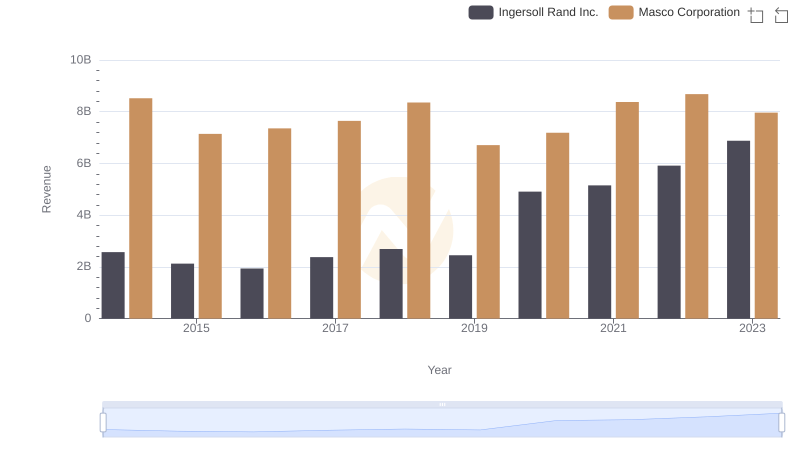
Revenue Insights: Ingersoll Rand Inc. and Masco Corporation Performance Compared
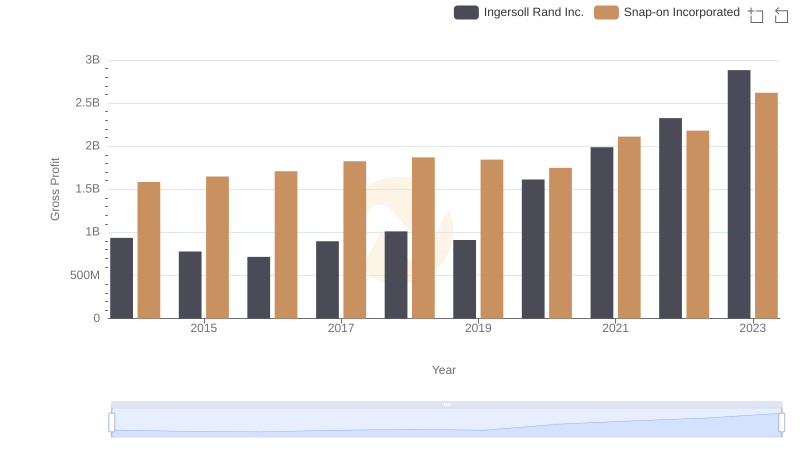
Key Insights on Gross Profit: Ingersoll Rand Inc. vs Snap-on Incorporated
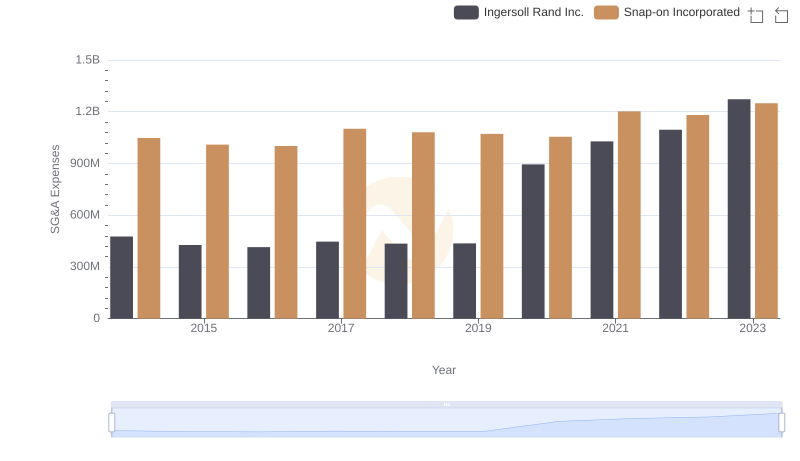
Cost Management Insights: SG&A Expenses for Ingersoll Rand Inc. and Snap-on Incorporated