| __timestamp | Booz Allen Hamilton Holding Corporation | Ingersoll Rand Inc. |
|---|---|---|
| Wednesday, January 1, 2014 | 5478693000 | 2570005000 |
| Thursday, January 1, 2015 | 5274770000 | 2126900000 |
| Friday, January 1, 2016 | 5405738000 | 1939436000 |
| Sunday, January 1, 2017 | 5804284000 | 2375400000 |
| Monday, January 1, 2018 | 6171853000 | 2689800000 |
| Tuesday, January 1, 2019 | 6704037000 | 2451900000 |
| Wednesday, January 1, 2020 | 7463841000 | 4910200000 |
| Friday, January 1, 2021 | 7858938000 | 5152400000 |
| Saturday, January 1, 2022 | 8363700000 | 5916300000 |
| Sunday, January 1, 2023 | 9258911000 | 6876100000 |
| Monday, January 1, 2024 | 10661896000 | 0 |
Data in motion
In the competitive landscape of American business, Ingersoll Rand Inc. and Booz Allen Hamilton Holding Corporation have showcased remarkable revenue trajectories over the past decade. Since 2014, Booz Allen Hamilton has consistently outperformed, with a revenue increase of approximately 95%, reaching its peak in 2024. Ingersoll Rand, while trailing, has demonstrated a robust growth of around 167% from 2014 to 2023.
Booz Allen Hamilton's revenue growth reflects its strategic expansion and adaptation to market demands, particularly in the consulting sector. Meanwhile, Ingersoll Rand's significant leap in 2020, with a 100% increase from the previous year, highlights its resilience and strategic pivots in the industrial sector.
While Booz Allen's 2024 data is available, Ingersoll Rand's is notably absent, leaving room for speculation on its future trajectory.
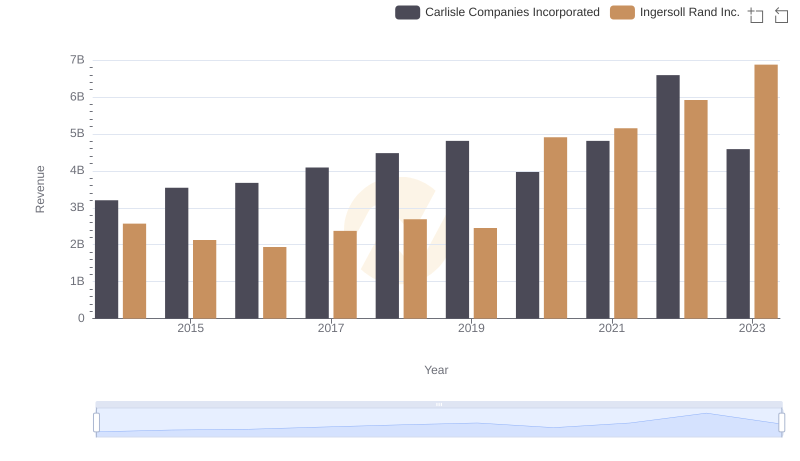
Ingersoll Rand Inc. vs Carlisle Companies Incorporated: Annual Revenue Growth Compared
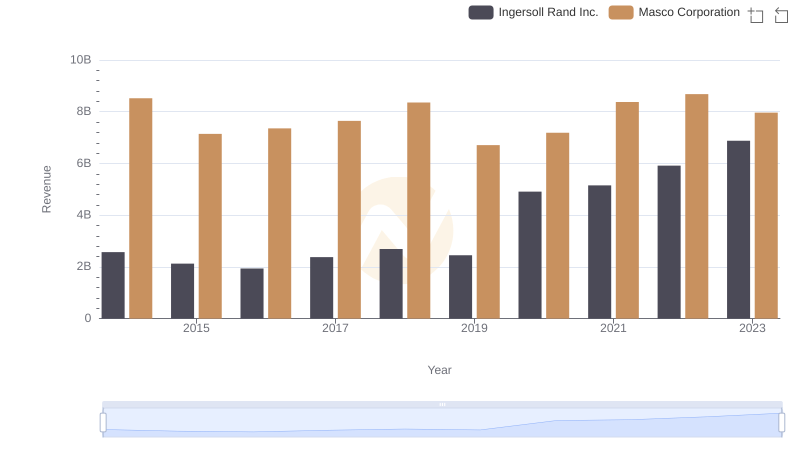
Revenue Insights: Ingersoll Rand Inc. and Masco Corporation Performance Compared
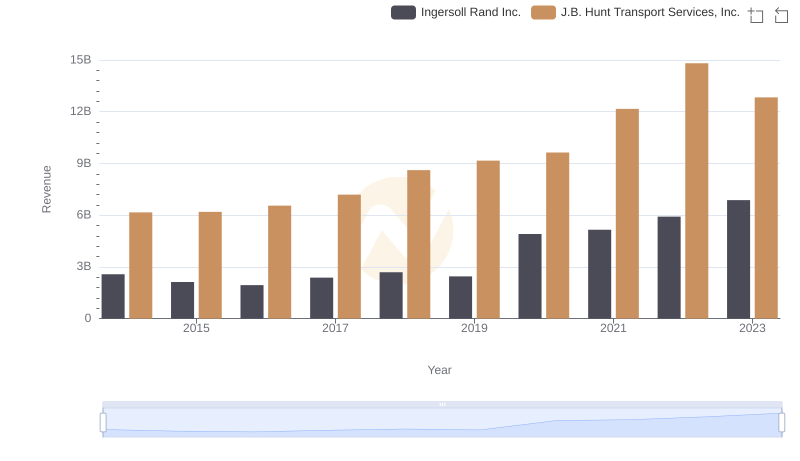
Comparing Revenue Performance: Ingersoll Rand Inc. or J.B. Hunt Transport Services, Inc.?
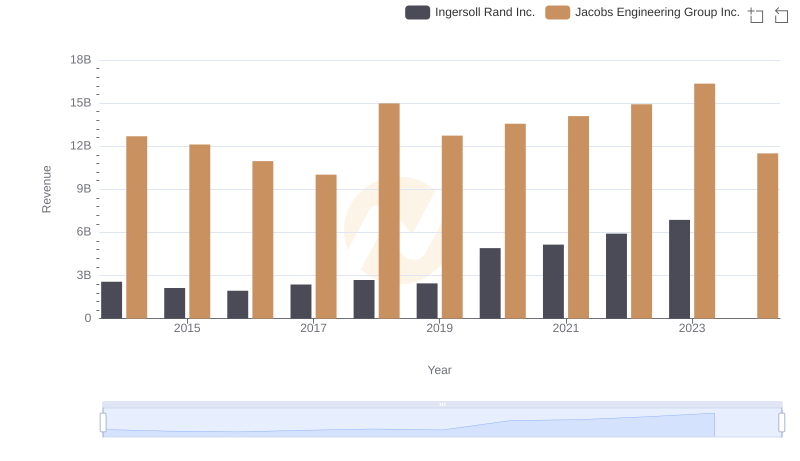
Ingersoll Rand Inc. and Jacobs Engineering Group Inc.: A Comprehensive Revenue Analysis
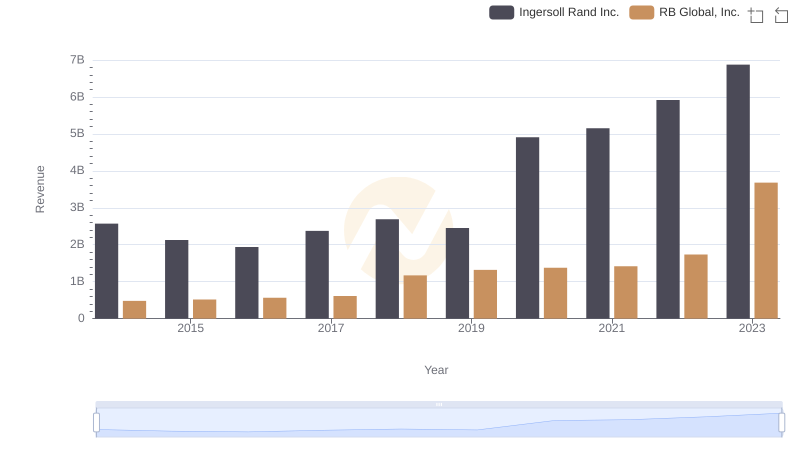
Breaking Down Revenue Trends: Ingersoll Rand Inc. vs RB Global, Inc.
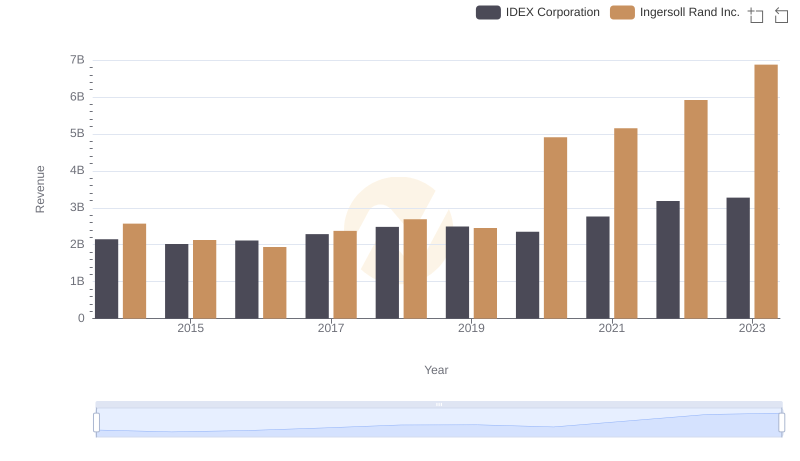
Ingersoll Rand Inc. vs IDEX Corporation: Annual Revenue Growth Compared
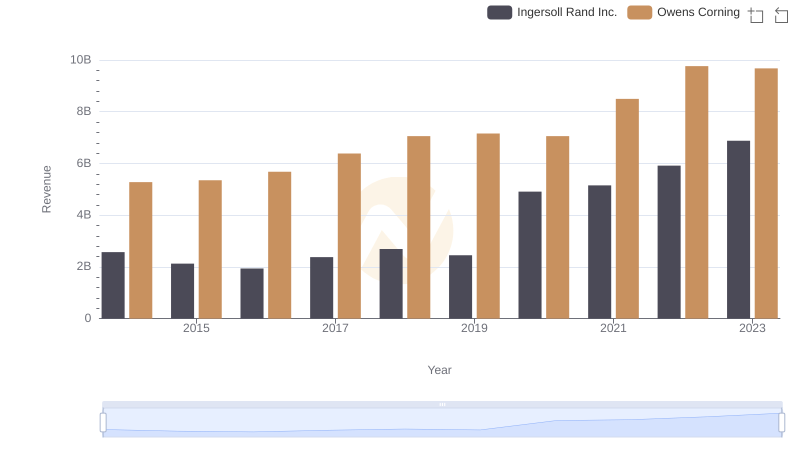
Annual Revenue Comparison: Ingersoll Rand Inc. vs Owens Corning
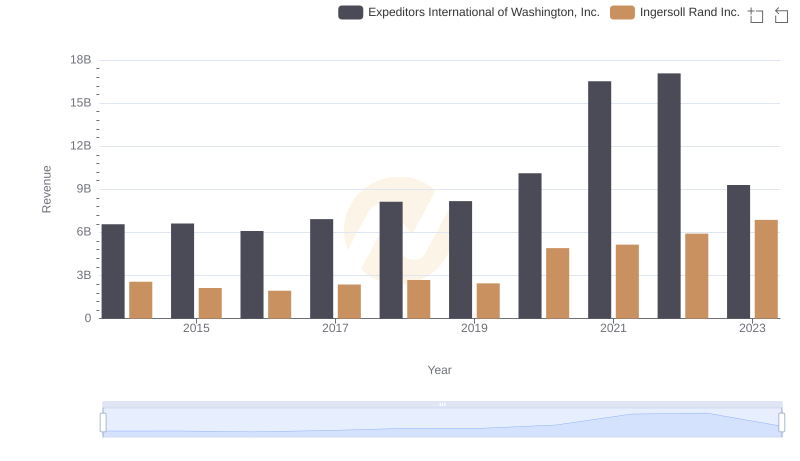
Revenue Insights: Ingersoll Rand Inc. and Expeditors International of Washington, Inc. Performance Compared