| __timestamp | Ingersoll Rand Inc. | RB Global, Inc. |
|---|---|---|
| Wednesday, January 1, 2014 | 2570005000 | 481097000 |
| Thursday, January 1, 2015 | 2126900000 | 515875000 |
| Friday, January 1, 2016 | 1939436000 | 566395000 |
| Sunday, January 1, 2017 | 2375400000 | 610517000 |
| Monday, January 1, 2018 | 2689800000 | 1170026000 |
| Tuesday, January 1, 2019 | 2451900000 | 1318641000 |
| Wednesday, January 1, 2020 | 4910200000 | 1377260000 |
| Friday, January 1, 2021 | 5152400000 | 1416971000 |
| Saturday, January 1, 2022 | 5916300000 | 1733808000 |
| Sunday, January 1, 2023 | 6876100000 | 3679600000 |
| Monday, January 1, 2024 | 0 | 4284200000 |
In pursuit of knowledge
In the ever-evolving landscape of industrial and auction services, Ingersoll Rand Inc. and RB Global, Inc. have showcased intriguing revenue trajectories over the past decade. From 2014 to 2023, Ingersoll Rand Inc. has seen a remarkable growth, with its revenue surging by approximately 168%, from $2.57 billion to $6.88 billion. This growth reflects the company's strategic expansions and robust market presence.
Conversely, RB Global, Inc., a leader in auction services, has experienced a more modest yet steady increase in revenue, growing by over 660% from $481 million in 2014 to $3.68 billion in 2023. This growth underscores the rising demand for auction services in a digital-first world.
These trends highlight the dynamic nature of these industries, with Ingersoll Rand Inc. capitalizing on industrial innovations and RB Global, Inc. leveraging digital transformations to drive revenue growth.
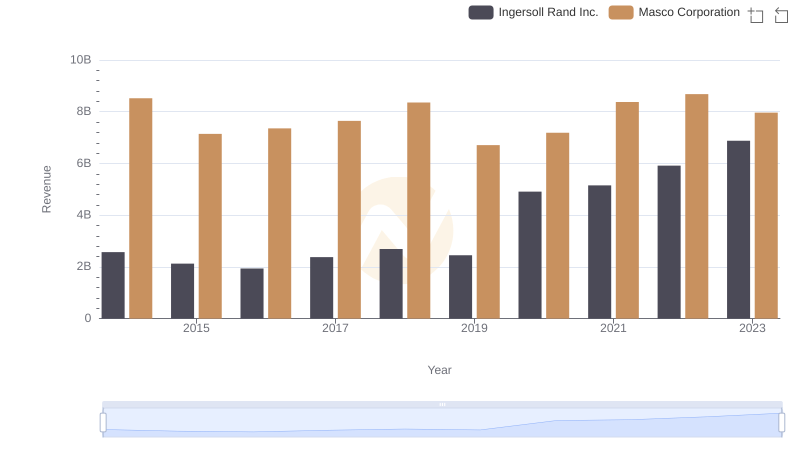
Revenue Insights: Ingersoll Rand Inc. and Masco Corporation Performance Compared
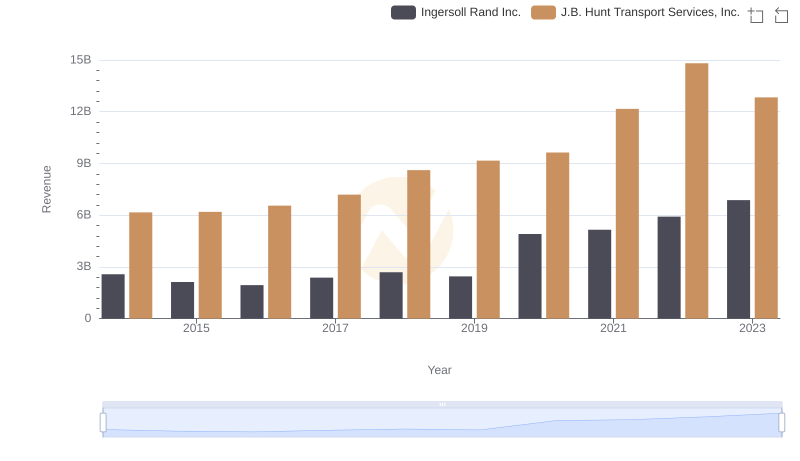
Comparing Revenue Performance: Ingersoll Rand Inc. or J.B. Hunt Transport Services, Inc.?
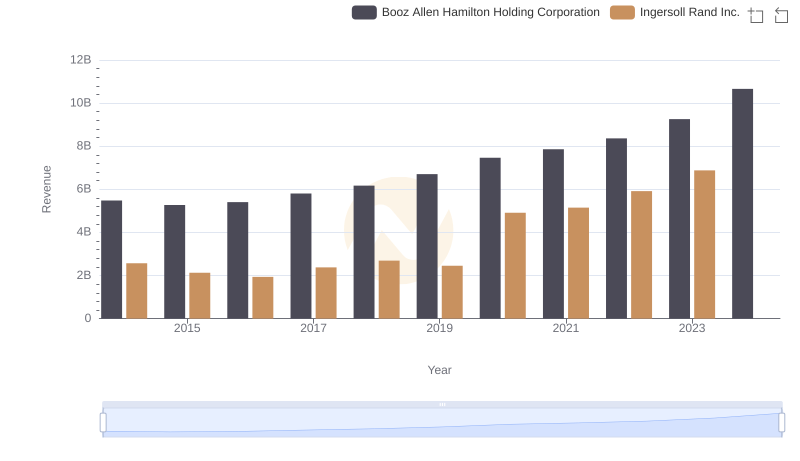
Revenue Insights: Ingersoll Rand Inc. and Booz Allen Hamilton Holding Corporation Performance Compared
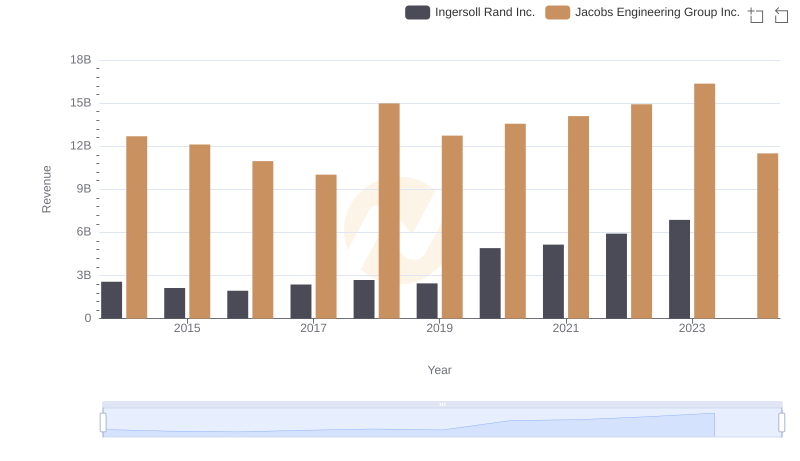
Ingersoll Rand Inc. and Jacobs Engineering Group Inc.: A Comprehensive Revenue Analysis
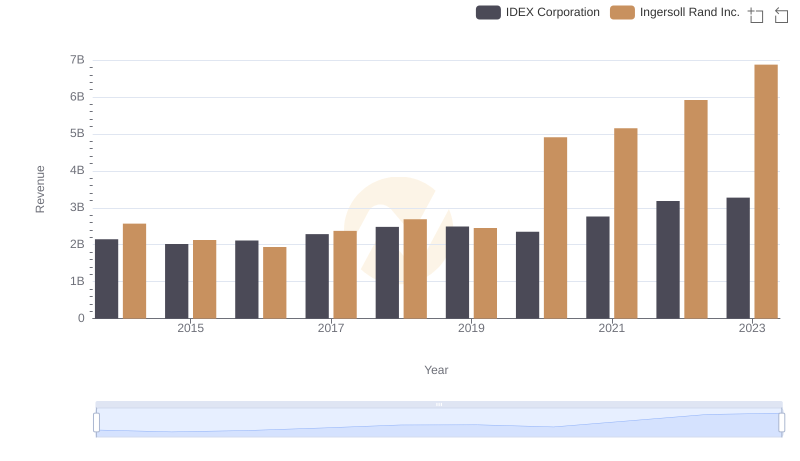
Ingersoll Rand Inc. vs IDEX Corporation: Annual Revenue Growth Compared
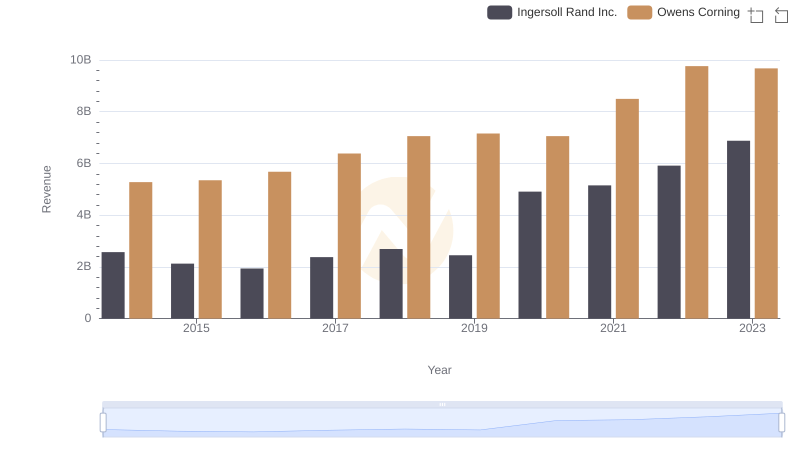
Annual Revenue Comparison: Ingersoll Rand Inc. vs Owens Corning
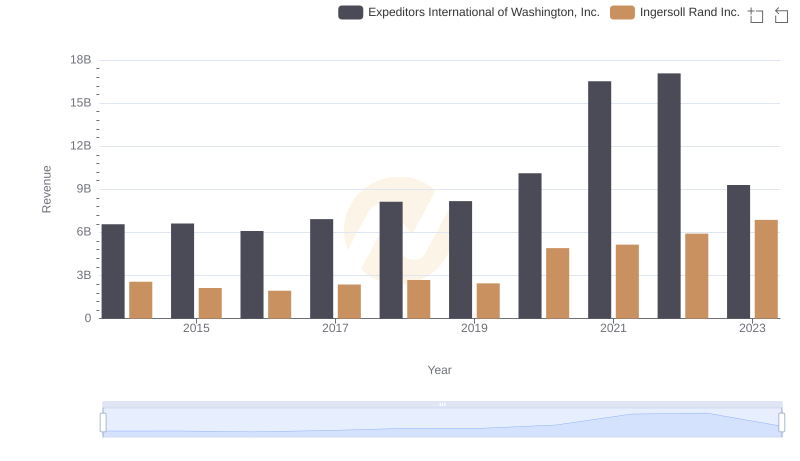
Revenue Insights: Ingersoll Rand Inc. and Expeditors International of Washington, Inc. Performance Compared
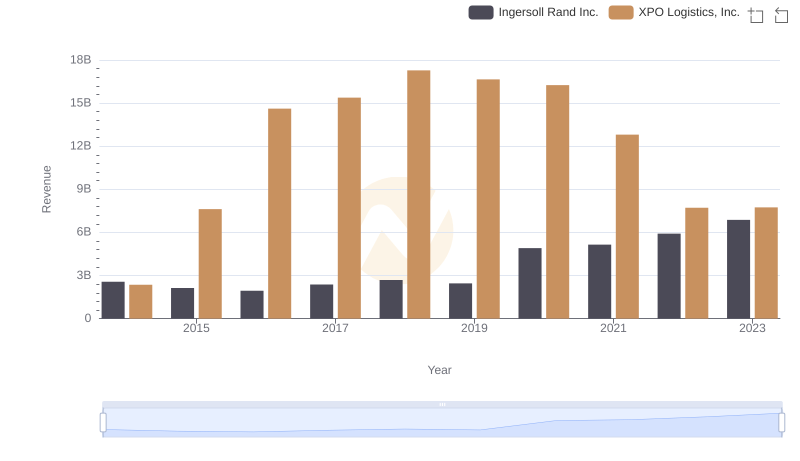
Annual Revenue Comparison: Ingersoll Rand Inc. vs XPO Logistics, Inc.
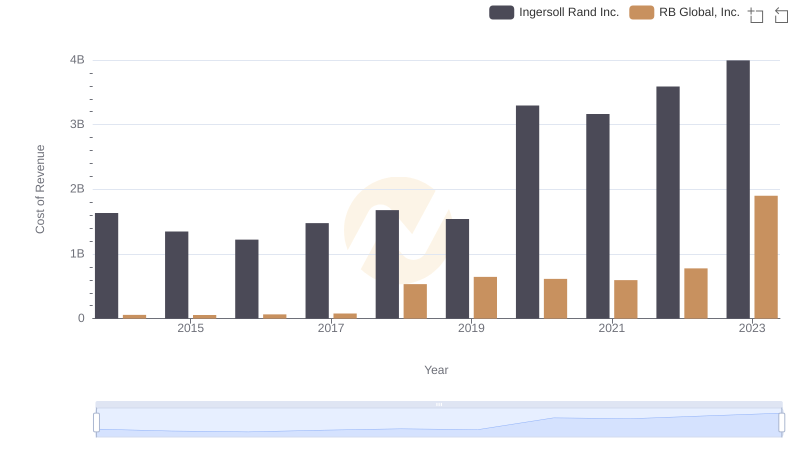
Analyzing Cost of Revenue: Ingersoll Rand Inc. and RB Global, Inc.
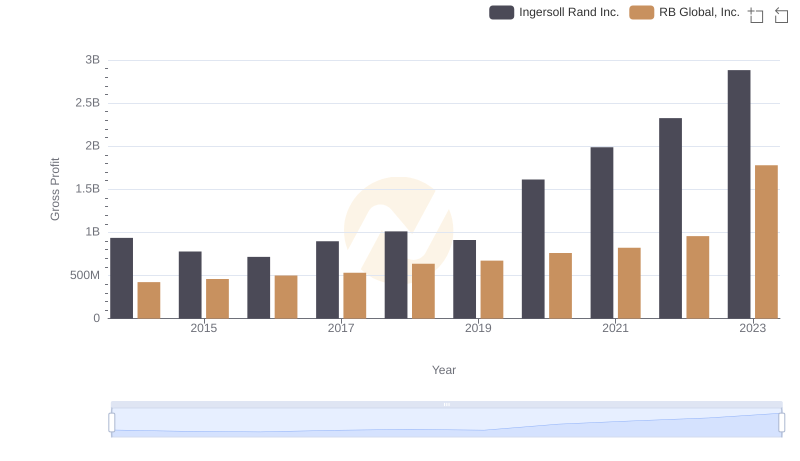
Gross Profit Analysis: Comparing Ingersoll Rand Inc. and RB Global, Inc.