| __timestamp | Carlisle Companies Incorporated | Ingersoll Rand Inc. |
|---|---|---|
| Wednesday, January 1, 2014 | 3204000000 | 2570005000 |
| Thursday, January 1, 2015 | 3543200000 | 2126900000 |
| Friday, January 1, 2016 | 3675400000 | 1939436000 |
| Sunday, January 1, 2017 | 4089900000 | 2375400000 |
| Monday, January 1, 2018 | 4479500000 | 2689800000 |
| Tuesday, January 1, 2019 | 4811600000 | 2451900000 |
| Wednesday, January 1, 2020 | 3969900000 | 4910200000 |
| Friday, January 1, 2021 | 4810300000 | 5152400000 |
| Saturday, January 1, 2022 | 6591900000 | 5916300000 |
| Sunday, January 1, 2023 | 4586900000 | 6876100000 |
| Monday, January 1, 2024 | 5003600000 | 0 |
Unlocking the unknown
In the ever-evolving landscape of industrial manufacturing, two giants, Ingersoll Rand Inc. and Carlisle Companies Incorporated, have showcased intriguing revenue trajectories over the past decade. From 2014 to 2023, Carlisle Companies saw a steady climb, peaking in 2022 with a remarkable 106% increase from its 2014 revenue. However, 2023 marked a downturn, with revenues dropping by 30% from the previous year.
Conversely, Ingersoll Rand Inc. experienced a more volatile journey. After a dip in 2016, the company rebounded, achieving a 168% growth by 2023 compared to its 2014 figures. Notably, 2020 was a pivotal year, with revenues surging by 100% from 2019, reflecting strategic shifts and market adaptations.
These trends underscore the dynamic nature of the industrial sector, where adaptability and innovation drive long-term success.
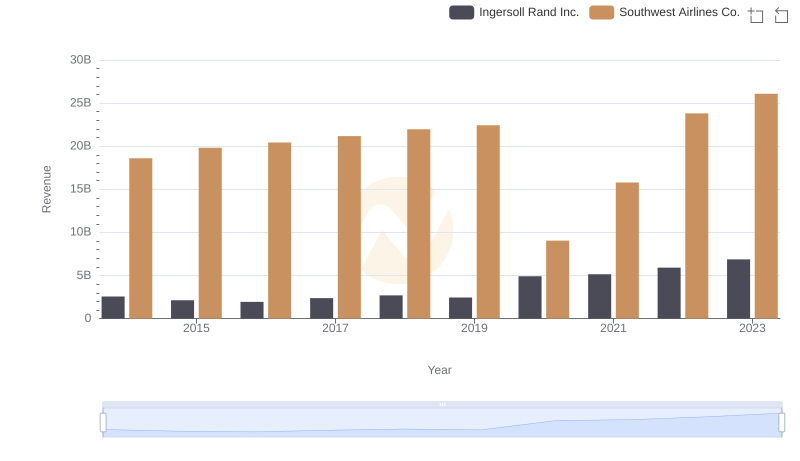
Ingersoll Rand Inc. vs Southwest Airlines Co.: Examining Key Revenue Metrics
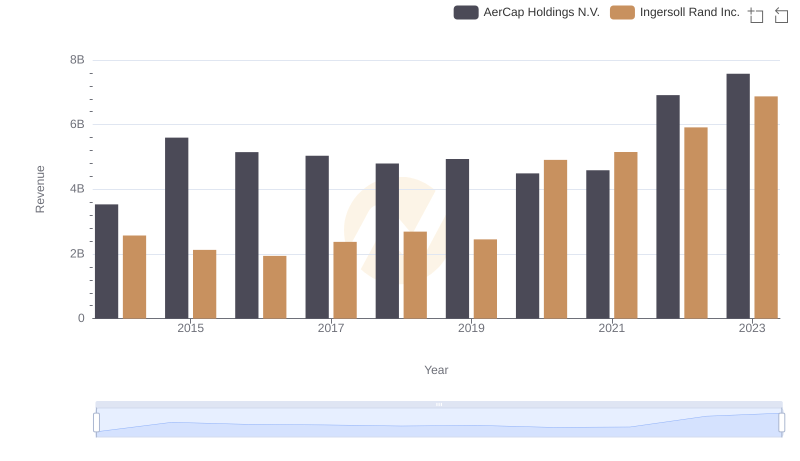
Revenue Insights: Ingersoll Rand Inc. and AerCap Holdings N.V. Performance Compared
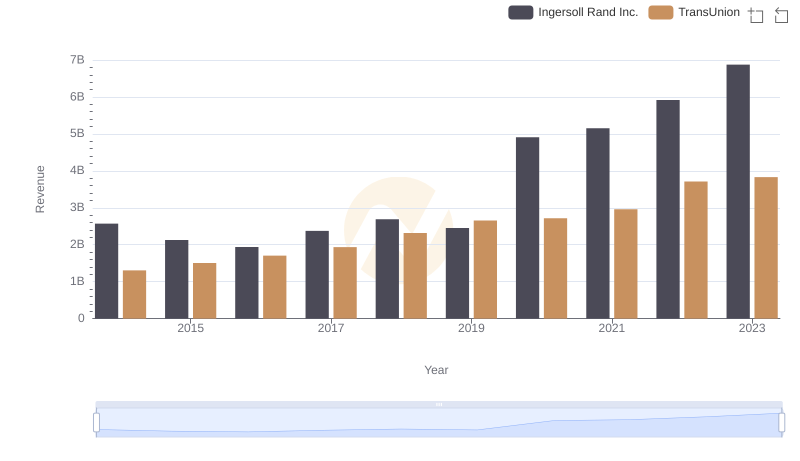
Ingersoll Rand Inc. vs TransUnion: Annual Revenue Growth Compared
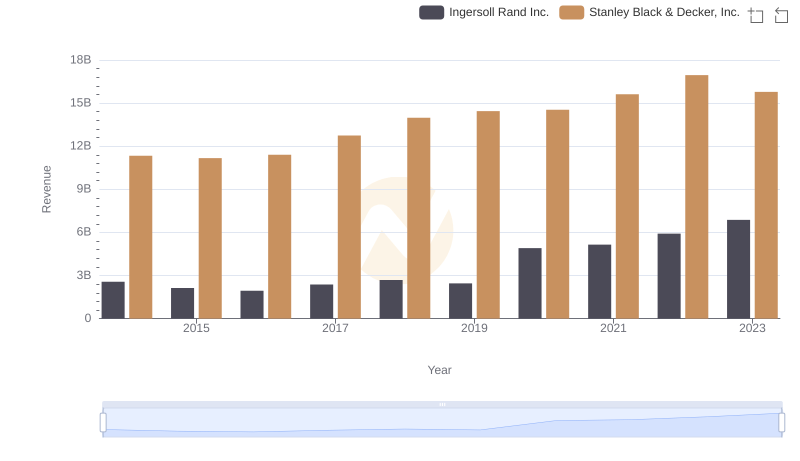
Ingersoll Rand Inc. and Stanley Black & Decker, Inc.: A Comprehensive Revenue Analysis
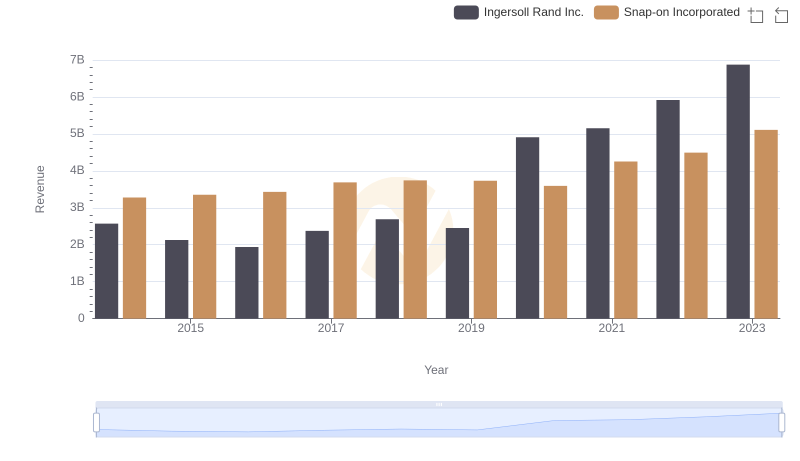
Ingersoll Rand Inc. vs Snap-on Incorporated: Examining Key Revenue Metrics
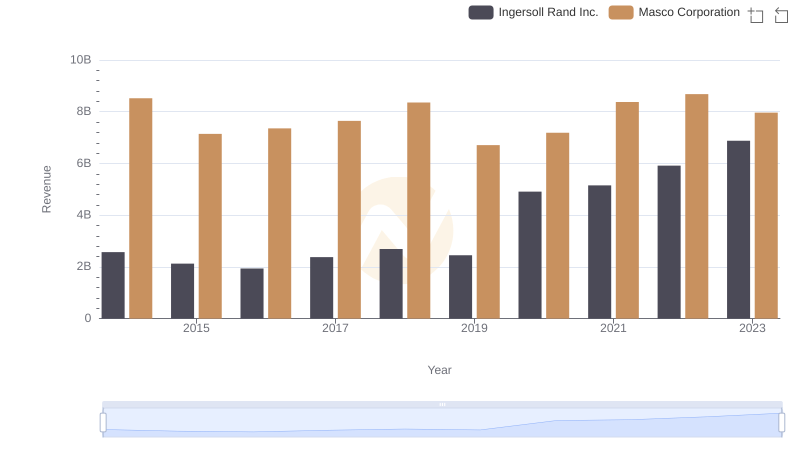
Revenue Insights: Ingersoll Rand Inc. and Masco Corporation Performance Compared
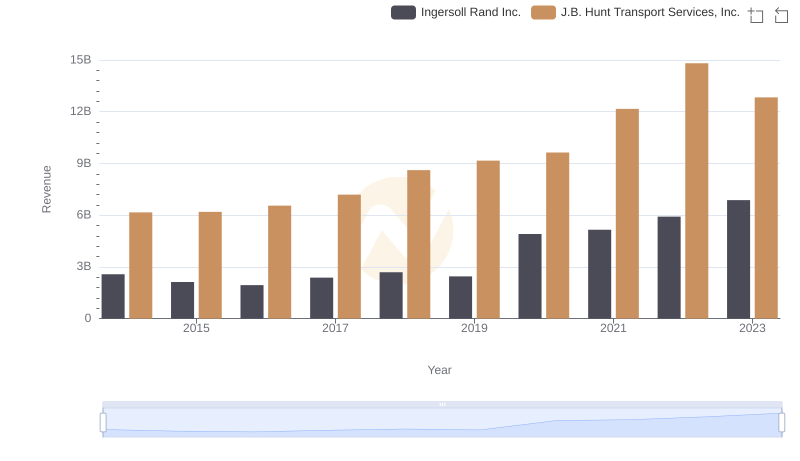
Comparing Revenue Performance: Ingersoll Rand Inc. or J.B. Hunt Transport Services, Inc.?
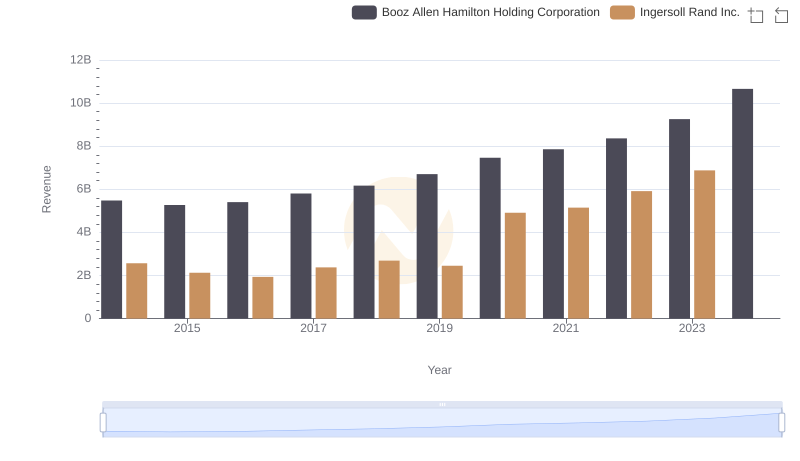
Revenue Insights: Ingersoll Rand Inc. and Booz Allen Hamilton Holding Corporation Performance Compared
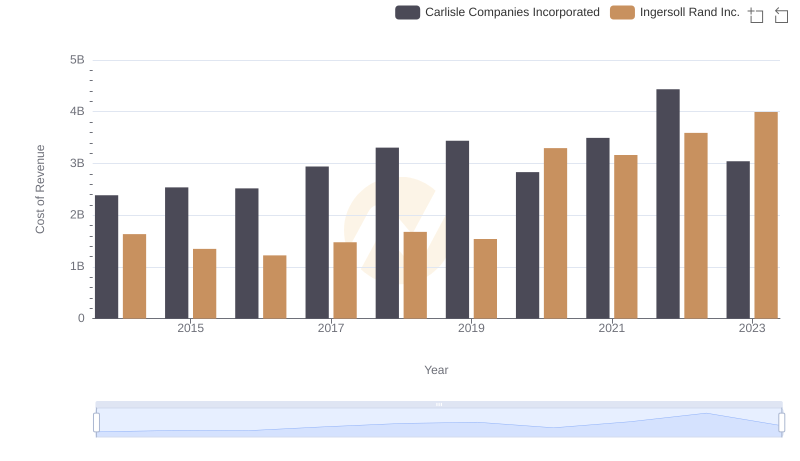
Cost of Revenue Trends: Ingersoll Rand Inc. vs Carlisle Companies Incorporated
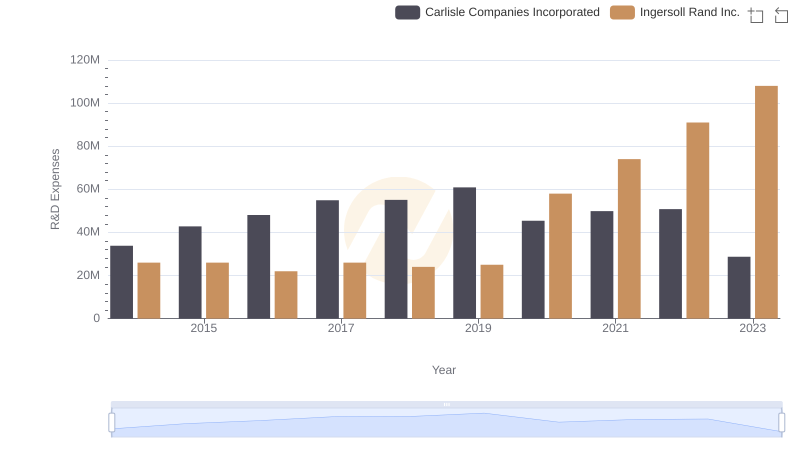
Research and Development: Comparing Key Metrics for Ingersoll Rand Inc. and Carlisle Companies Incorporated