| __timestamp | Ingersoll Rand Inc. | J.B. Hunt Transport Services, Inc. |
|---|---|---|
| Wednesday, January 1, 2014 | 2570005000 | 6165441000 |
| Thursday, January 1, 2015 | 2126900000 | 6187646000 |
| Friday, January 1, 2016 | 1939436000 | 6555459000 |
| Sunday, January 1, 2017 | 2375400000 | 7189568000 |
| Monday, January 1, 2018 | 2689800000 | 8614874000 |
| Tuesday, January 1, 2019 | 2451900000 | 9165258000 |
| Wednesday, January 1, 2020 | 4910200000 | 9636573000 |
| Friday, January 1, 2021 | 5152400000 | 12168302000 |
| Saturday, January 1, 2022 | 5916300000 | 14813999000 |
| Sunday, January 1, 2023 | 6876100000 | 12829665000 |
| Monday, January 1, 2024 | 0 |
Cracking the code
In the ever-evolving landscape of American industry, two giants stand out for their impressive revenue trajectories over the past decade: Ingersoll Rand Inc. and J.B. Hunt Transport Services, Inc. From 2014 to 2023, J.B. Hunt consistently outperformed Ingersoll Rand, with revenues peaking at approximately $14.8 billion in 2022, marking a remarkable 140% increase from 2014. In contrast, Ingersoll Rand's revenue growth was more modest, yet still notable, with a 167% increase, reaching around $6.9 billion in 2023.
This comparison highlights the dynamic nature of the industrial and transport sectors, where strategic innovation and market adaptation are key. While J.B. Hunt's steady climb underscores its dominance in logistics, Ingersoll Rand's recent surge suggests a promising trajectory in the industrial sector. As these companies continue to evolve, their revenue trends offer valuable insights into their strategic directions and market positions.
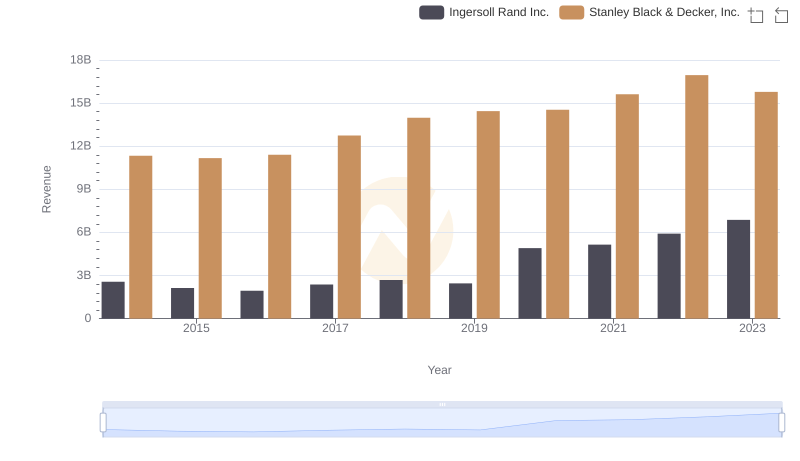
Ingersoll Rand Inc. and Stanley Black & Decker, Inc.: A Comprehensive Revenue Analysis
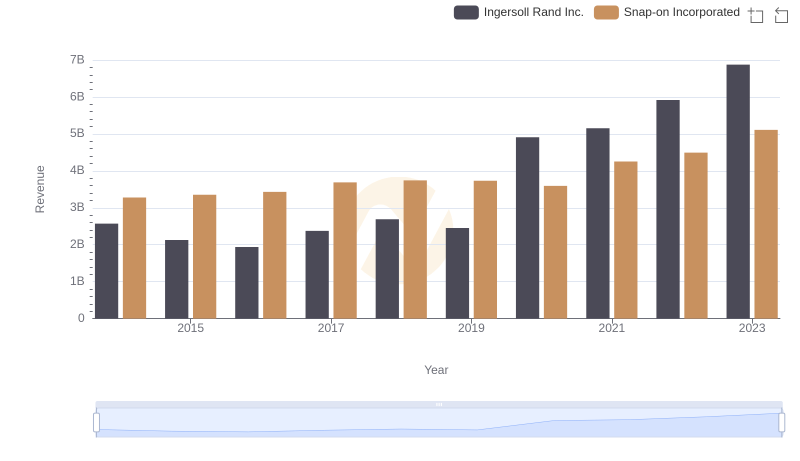
Ingersoll Rand Inc. vs Snap-on Incorporated: Examining Key Revenue Metrics
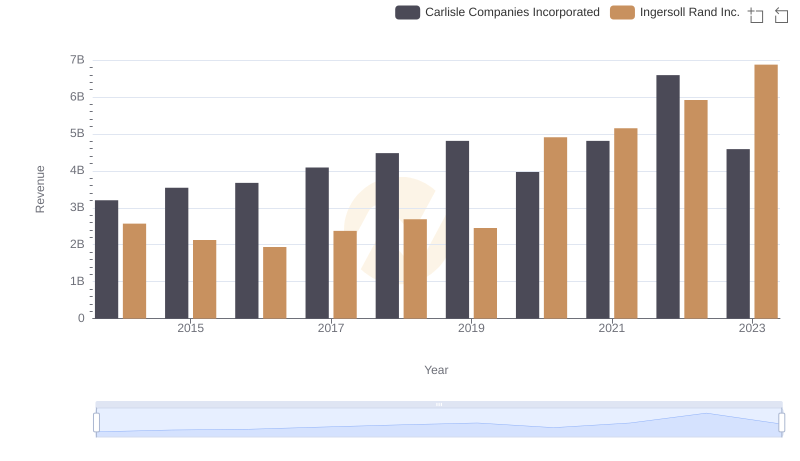
Ingersoll Rand Inc. vs Carlisle Companies Incorporated: Annual Revenue Growth Compared
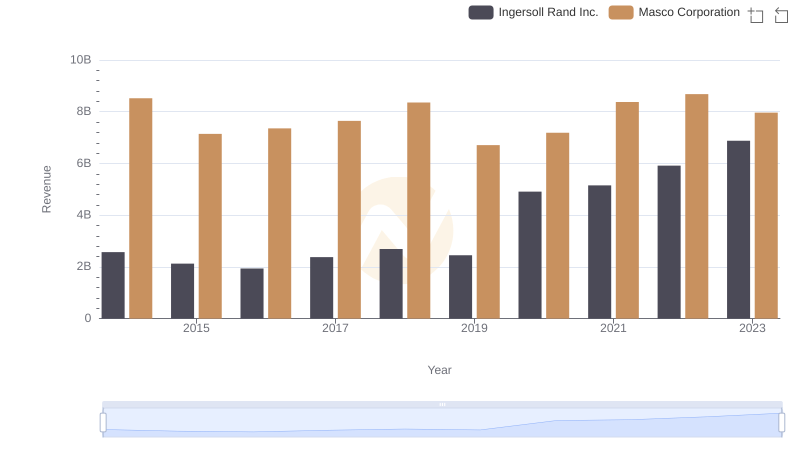
Revenue Insights: Ingersoll Rand Inc. and Masco Corporation Performance Compared
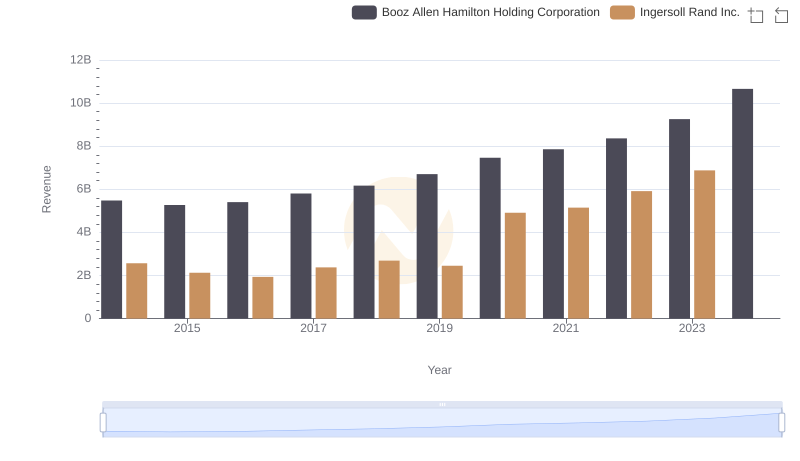
Revenue Insights: Ingersoll Rand Inc. and Booz Allen Hamilton Holding Corporation Performance Compared
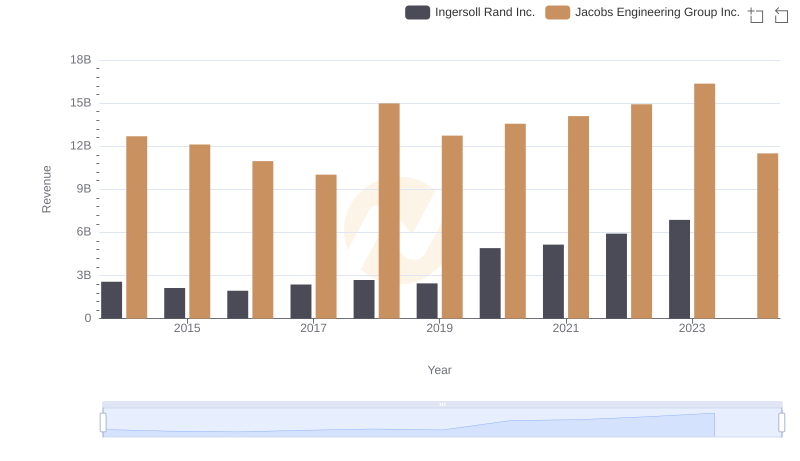
Ingersoll Rand Inc. and Jacobs Engineering Group Inc.: A Comprehensive Revenue Analysis
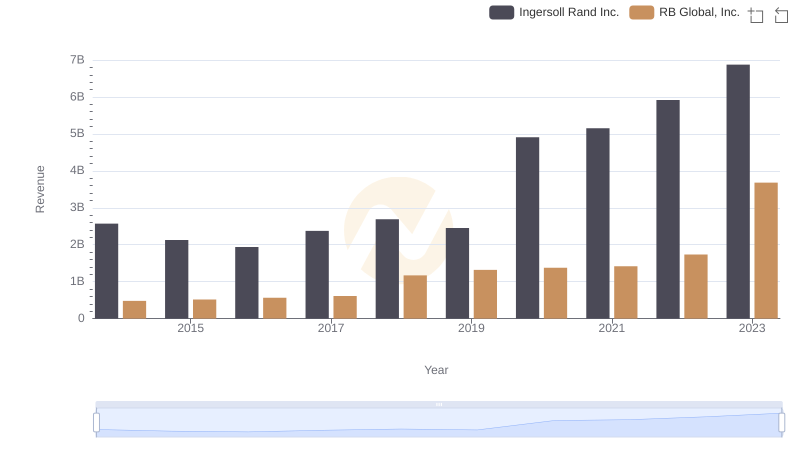
Breaking Down Revenue Trends: Ingersoll Rand Inc. vs RB Global, Inc.
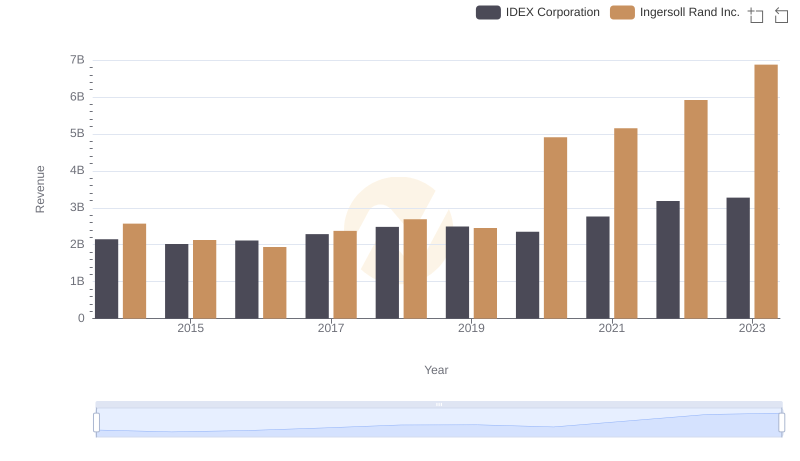
Ingersoll Rand Inc. vs IDEX Corporation: Annual Revenue Growth Compared
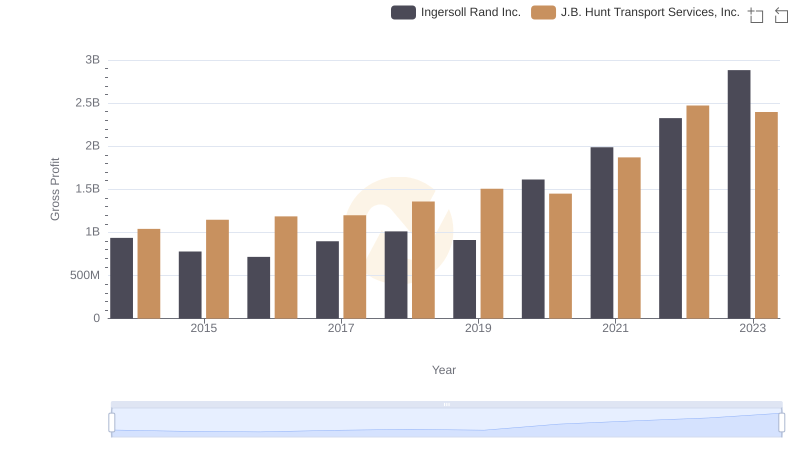
Gross Profit Comparison: Ingersoll Rand Inc. and J.B. Hunt Transport Services, Inc. Trends
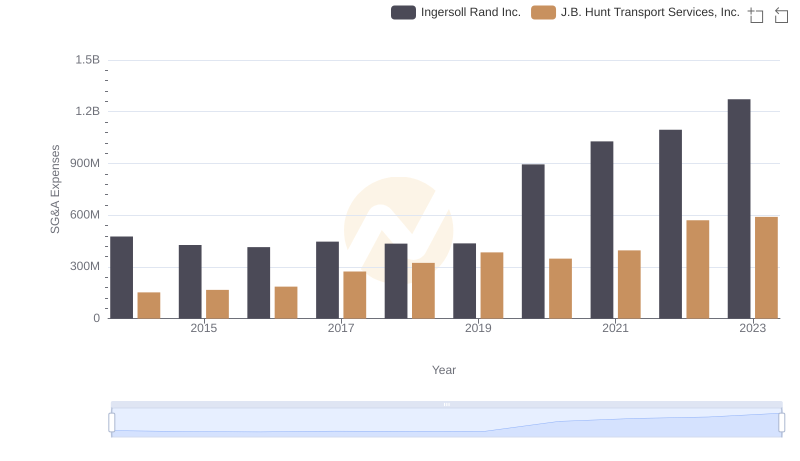
Ingersoll Rand Inc. or J.B. Hunt Transport Services, Inc.: Who Manages SG&A Costs Better?