| __timestamp | EMCOR Group, Inc. | Ingersoll Rand Inc. |
|---|---|---|
| Wednesday, January 1, 2014 | 6424965000 | 2570005000 |
| Thursday, January 1, 2015 | 6718726000 | 2126900000 |
| Friday, January 1, 2016 | 7551524000 | 1939436000 |
| Sunday, January 1, 2017 | 7686999000 | 2375400000 |
| Monday, January 1, 2018 | 8130631000 | 2689800000 |
| Tuesday, January 1, 2019 | 9174611000 | 2451900000 |
| Wednesday, January 1, 2020 | 8797061000 | 4910200000 |
| Friday, January 1, 2021 | 9903580000 | 5152400000 |
| Saturday, January 1, 2022 | 11076120000 | 5916300000 |
| Sunday, January 1, 2023 | 12582873000 | 6876100000 |
| Monday, January 1, 2024 | 0 |
Unleashing insights
In the ever-evolving landscape of industrial and construction services, two giants, Ingersoll Rand Inc. and EMCOR Group, Inc., have showcased intriguing revenue trajectories over the past decade. From 2014 to 2023, EMCOR Group, Inc. has consistently outperformed Ingersoll Rand Inc., with a revenue growth of approximately 96%, peaking at $12.6 billion in 2023. In contrast, Ingersoll Rand Inc. demonstrated a more modest growth of around 167%, reaching $6.9 billion in the same year. Notably, EMCOR's revenue surged by 40% from 2020 to 2023, reflecting its robust market position and strategic expansions. Meanwhile, Ingersoll Rand's revenue nearly doubled during this period, indicating a significant turnaround. These trends highlight the dynamic nature of the industry and the strategic maneuvers by these companies to capture market share and drive growth.
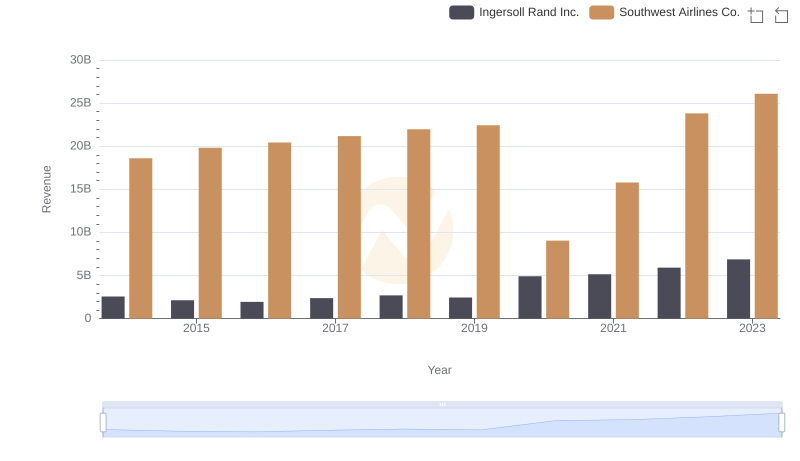
Ingersoll Rand Inc. vs Southwest Airlines Co.: Examining Key Revenue Metrics
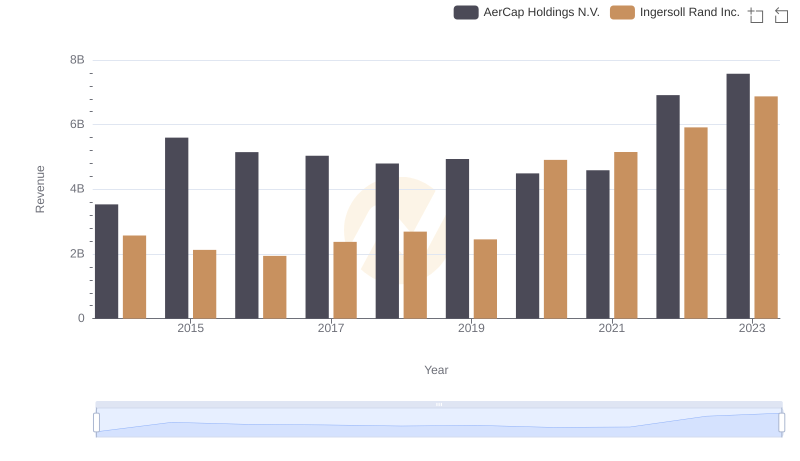
Revenue Insights: Ingersoll Rand Inc. and AerCap Holdings N.V. Performance Compared
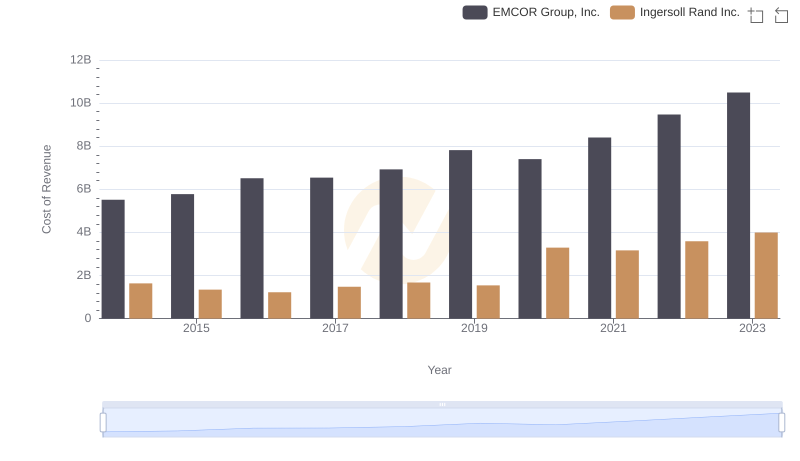
Comparing Cost of Revenue Efficiency: Ingersoll Rand Inc. vs EMCOR Group, Inc.
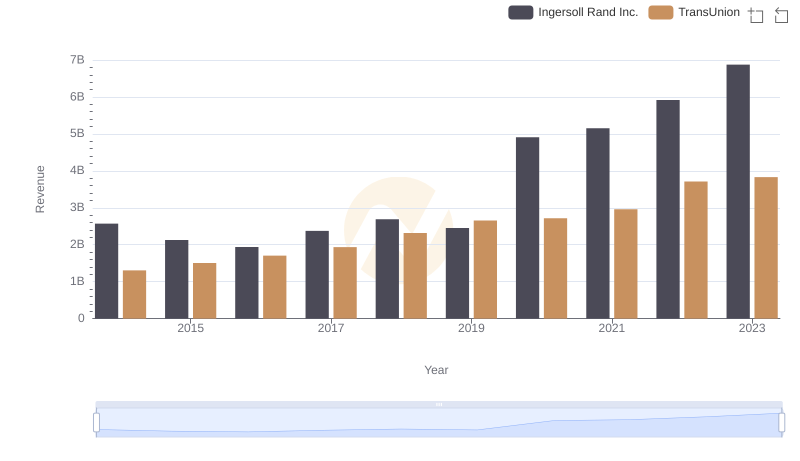
Ingersoll Rand Inc. vs TransUnion: Annual Revenue Growth Compared
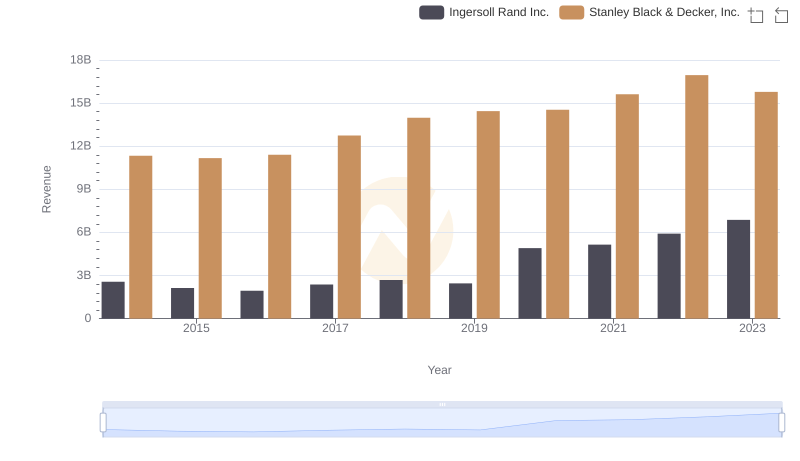
Ingersoll Rand Inc. and Stanley Black & Decker, Inc.: A Comprehensive Revenue Analysis
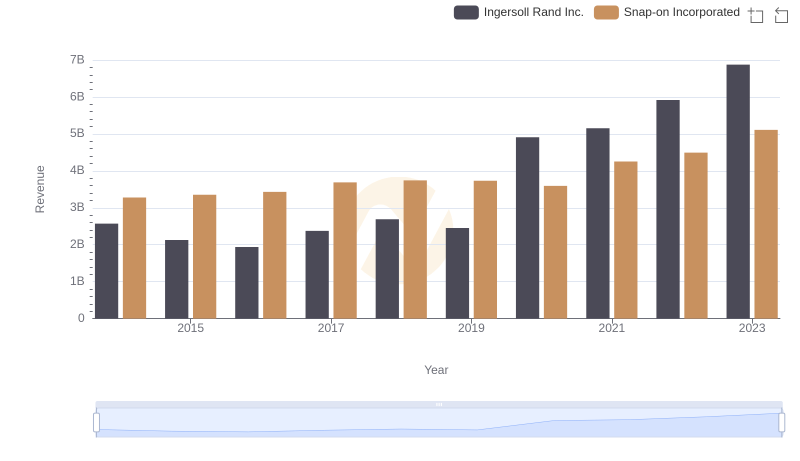
Ingersoll Rand Inc. vs Snap-on Incorporated: Examining Key Revenue Metrics
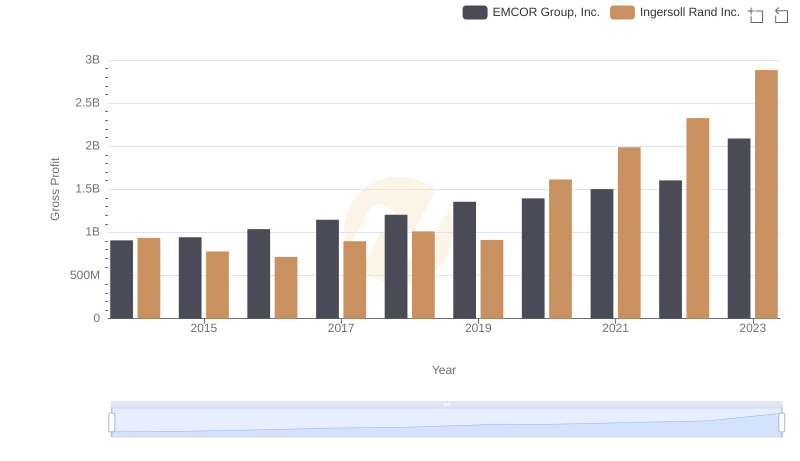
Gross Profit Comparison: Ingersoll Rand Inc. and EMCOR Group, Inc. Trends
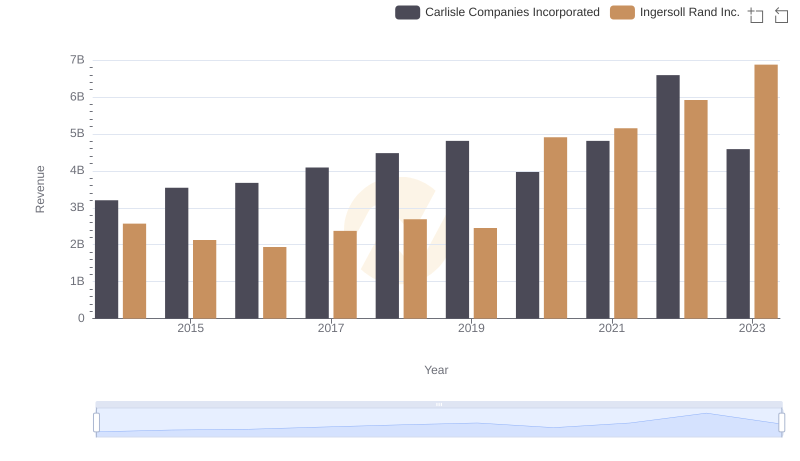
Ingersoll Rand Inc. vs Carlisle Companies Incorporated: Annual Revenue Growth Compared