| __timestamp | Old Dominion Freight Line, Inc. | U-Haul Holding Company |
|---|---|---|
| Wednesday, January 1, 2014 | 585590000 | 923383000 |
| Thursday, January 1, 2015 | 660570000 | 1076520000 |
| Friday, January 1, 2016 | 671786000 | 1255474000 |
| Sunday, January 1, 2017 | 783749000 | 1195593000 |
| Monday, January 1, 2018 | 1046059000 | 1123974000 |
| Tuesday, January 1, 2019 | 1078007000 | 1200955000 |
| Wednesday, January 1, 2020 | 1168149000 | 1202436000 |
| Friday, January 1, 2021 | 1651501000 | 1627442000 |
| Saturday, January 1, 2022 | 2118962000 | 2337788000 |
| Sunday, January 1, 2023 | 1972689000 | 2183839000 |
| Monday, January 1, 2024 | 1919656000 |
Unleashing insights
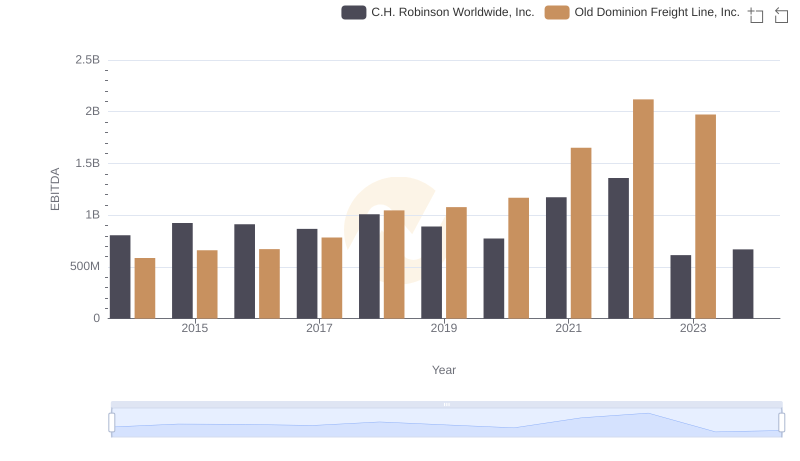
In the ever-evolving landscape of logistics and transportation, understanding financial health is crucial. This analysis delves into the EBITDA trends of Old Dominion Freight Line, Inc. and U-Haul Holding Company from 2014 to 2023. Over this decade, U-Haul consistently outperformed Old Dominion, with an average EBITDA approximately 24% higher. Notably, both companies experienced significant growth in 2022, with U-Haul reaching its peak EBITDA, marking a 90% increase from 2014. Old Dominion, while trailing, showed remarkable resilience, doubling its EBITDA over the same period. However, 2023 saw a slight decline for both, hinting at potential market challenges. Missing data for Old Dominion in 2024 suggests caution in future projections. This side-by-side analysis offers valuable insights into the financial trajectories of these industry giants, highlighting their strategic maneuvers in a competitive market.
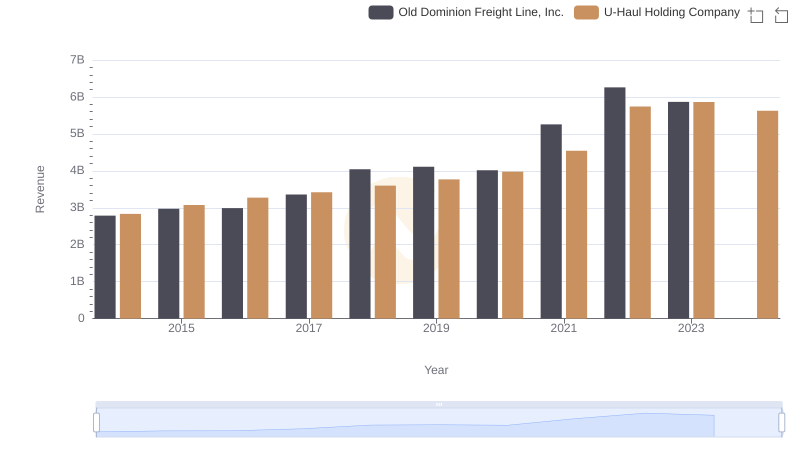
Old Dominion Freight Line, Inc. or U-Haul Holding Company: Who Leads in Yearly Revenue?
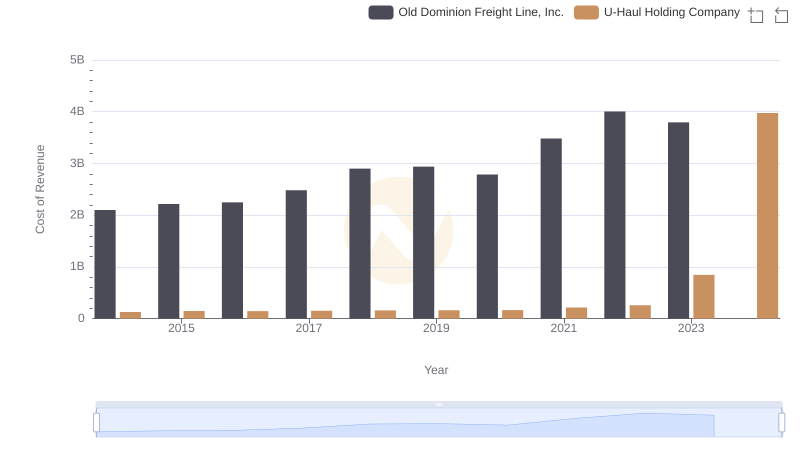
Cost of Revenue Trends: Old Dominion Freight Line, Inc. vs U-Haul Holding Company
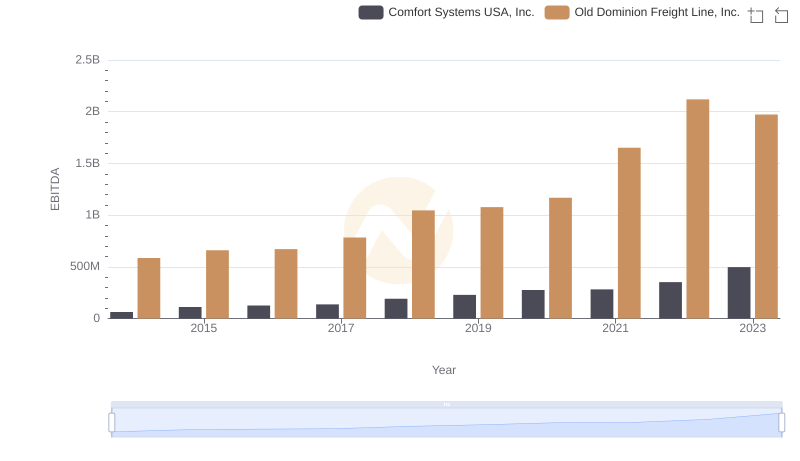
Professional EBITDA Benchmarking: Old Dominion Freight Line, Inc. vs Comfort Systems USA, Inc.
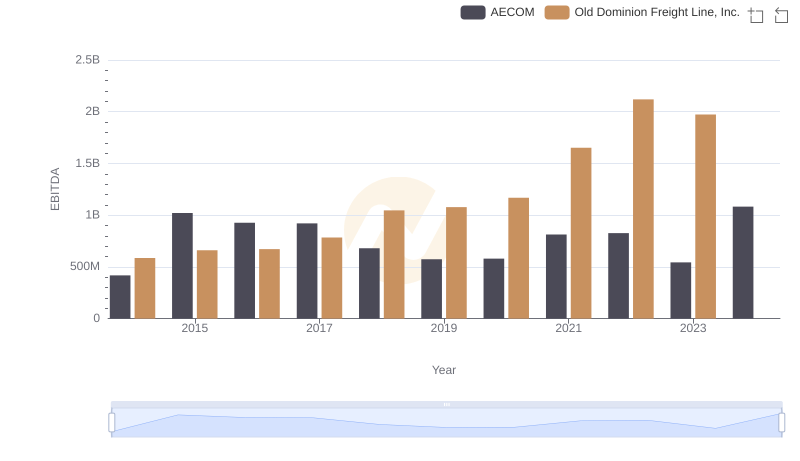
Old Dominion Freight Line, Inc. and AECOM: A Detailed Examination of EBITDA Performance
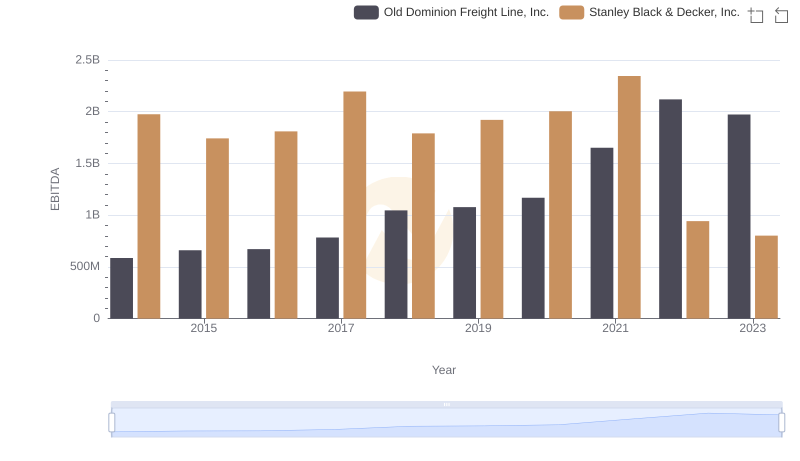
A Professional Review of EBITDA: Old Dominion Freight Line, Inc. Compared to Stanley Black & Decker, Inc.
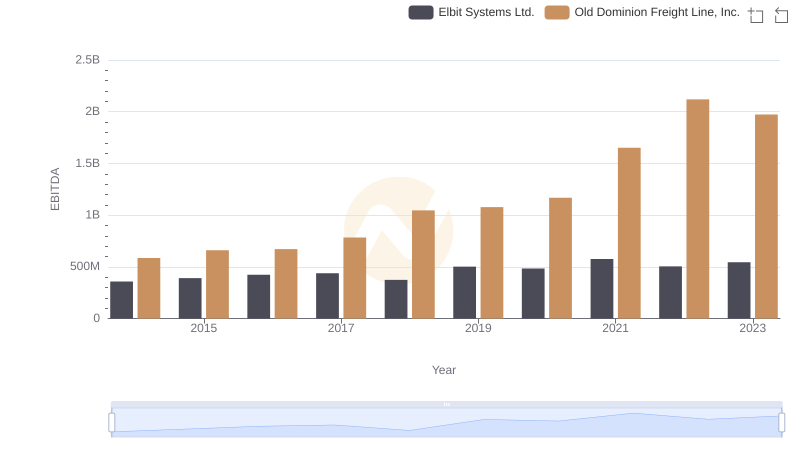
Comparative EBITDA Analysis: Old Dominion Freight Line, Inc. vs Elbit Systems Ltd.
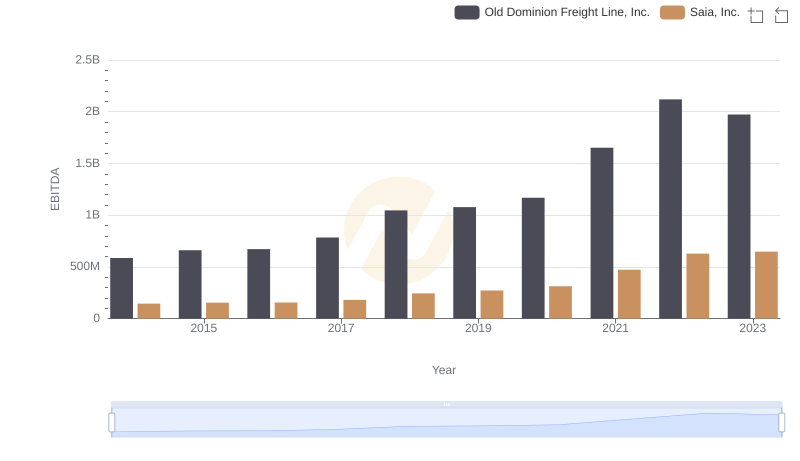
Comprehensive EBITDA Comparison: Old Dominion Freight Line, Inc. vs Saia, Inc.
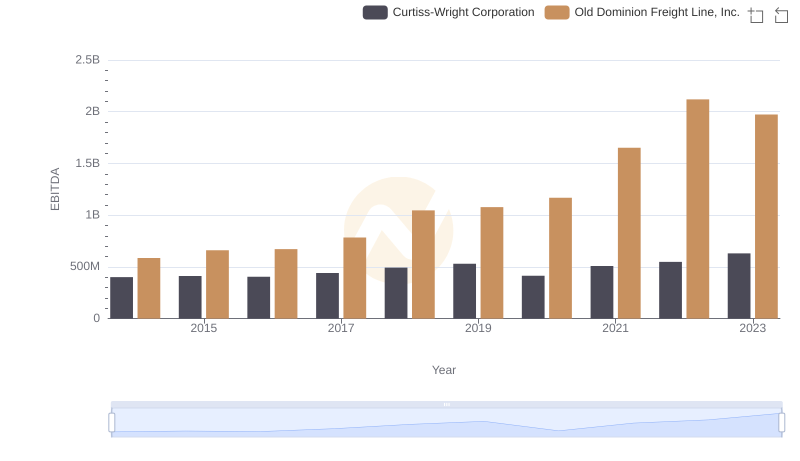
Professional EBITDA Benchmarking: Old Dominion Freight Line, Inc. vs Curtiss-Wright Corporation
A Professional Review of EBITDA: Old Dominion Freight Line, Inc. Compared to C.H. Robinson Worldwide, Inc.