| __timestamp | Old Dominion Freight Line, Inc. | Stanley Black & Decker, Inc. |
|---|---|---|
| Wednesday, January 1, 2014 | 585590000 | 1975400000 |
| Thursday, January 1, 2015 | 660570000 | 1741900000 |
| Friday, January 1, 2016 | 671786000 | 1810200000 |
| Sunday, January 1, 2017 | 783749000 | 2196000000 |
| Monday, January 1, 2018 | 1046059000 | 1791200000 |
| Tuesday, January 1, 2019 | 1078007000 | 1920600000 |
| Wednesday, January 1, 2020 | 1168149000 | 2004200000 |
| Friday, January 1, 2021 | 1651501000 | 2345500000 |
| Saturday, January 1, 2022 | 2118962000 | 942800000 |
| Sunday, January 1, 2023 | 1972689000 | 802700000 |
| Monday, January 1, 2024 | 286300000 |
Unleashing the power of data
In the ever-evolving landscape of American industry, the financial health of companies is often gauged by their EBITDA, a key indicator of operational performance. From 2014 to 2023, Old Dominion Freight Line, Inc. and Stanley Black & Decker, Inc. have showcased contrasting trajectories in their EBITDA growth.
Old Dominion Freight Line has demonstrated a remarkable upward trend, with its EBITDA growing by approximately 237% over the decade. This growth reflects the company's strategic expansion and operational efficiency, particularly evident in the significant leap from 2020 to 2022.
Conversely, Stanley Black & Decker experienced a more volatile journey. Despite a strong start, their EBITDA saw a decline of around 59% from 2021 to 2023, highlighting potential challenges in market dynamics or internal restructuring.
This comparative analysis underscores the dynamic nature of business performance, offering valuable insights for investors and industry analysts alike.
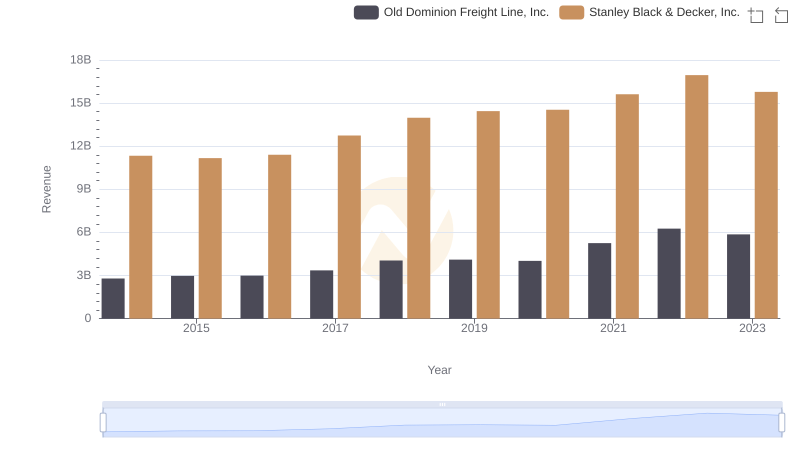
Comparing Revenue Performance: Old Dominion Freight Line, Inc. or Stanley Black & Decker, Inc.?
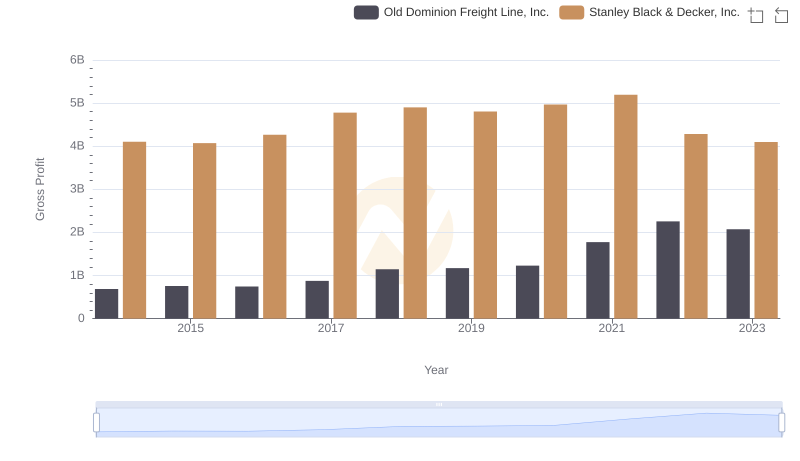
Gross Profit Comparison: Old Dominion Freight Line, Inc. and Stanley Black & Decker, Inc. Trends
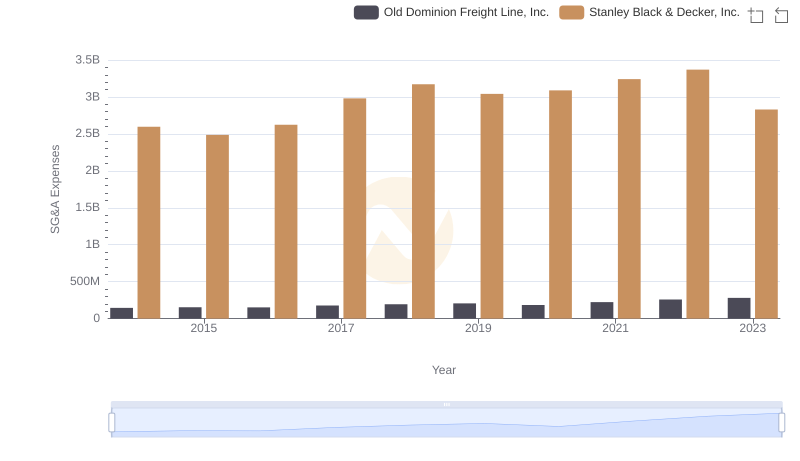
Old Dominion Freight Line, Inc. or Stanley Black & Decker, Inc.: Who Manages SG&A Costs Better?
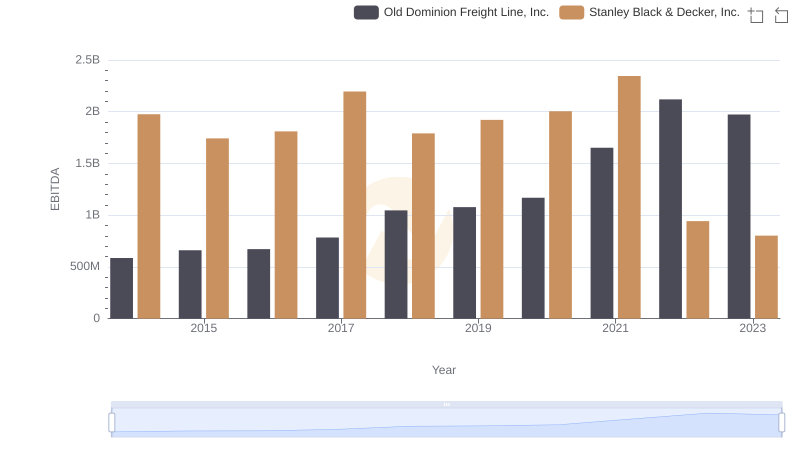
Old Dominion Freight Line, Inc. vs Stanley Black & Decker, Inc.: In-Depth EBITDA Performance Comparison
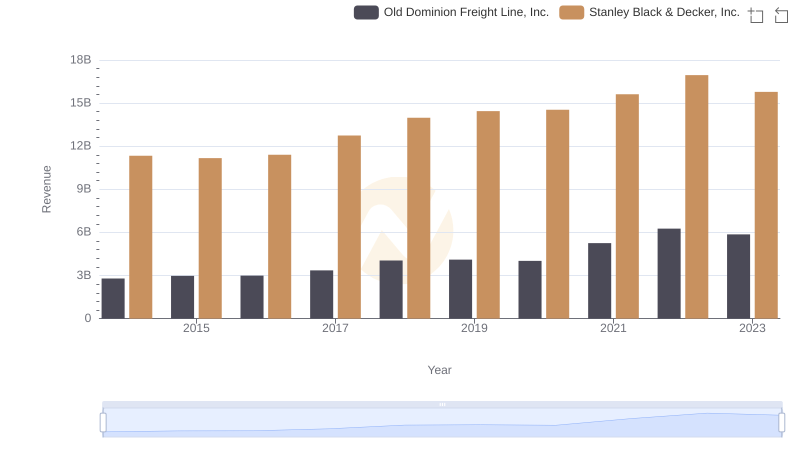
Old Dominion Freight Line, Inc. vs Stanley Black & Decker, Inc.: Annual Revenue Growth Compared
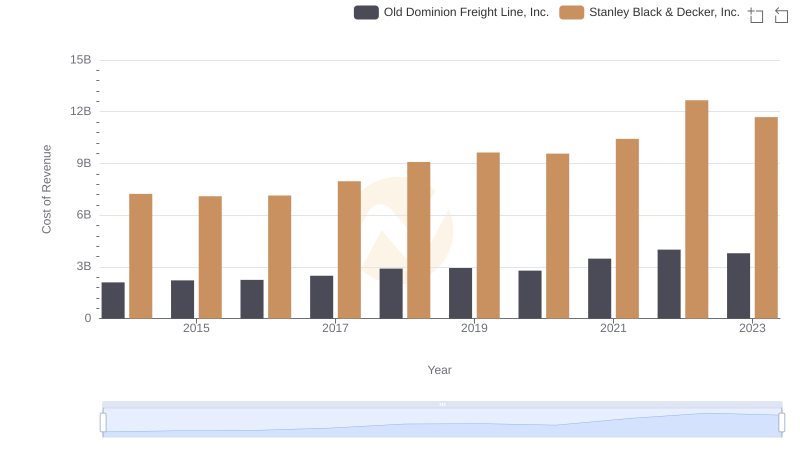
Cost Insights: Breaking Down Old Dominion Freight Line, Inc. and Stanley Black & Decker, Inc.'s Expenses

SG&A Efficiency Analysis: Comparing Old Dominion Freight Line, Inc. and Stanley Black & Decker, Inc.
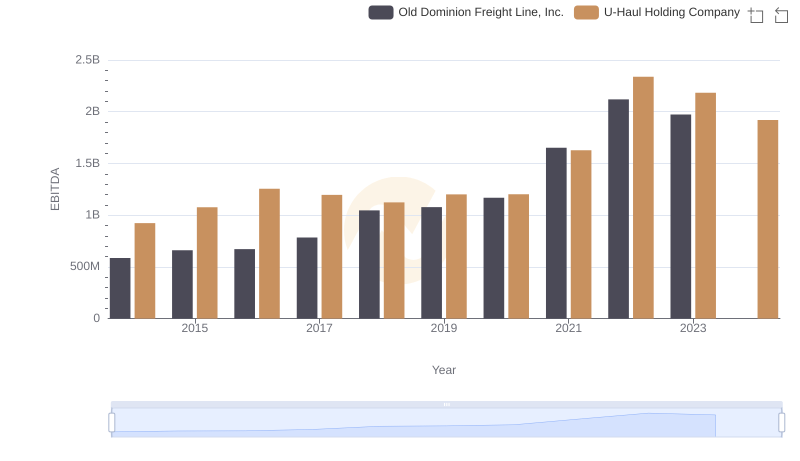
A Side-by-Side Analysis of EBITDA: Old Dominion Freight Line, Inc. and U-Haul Holding Company
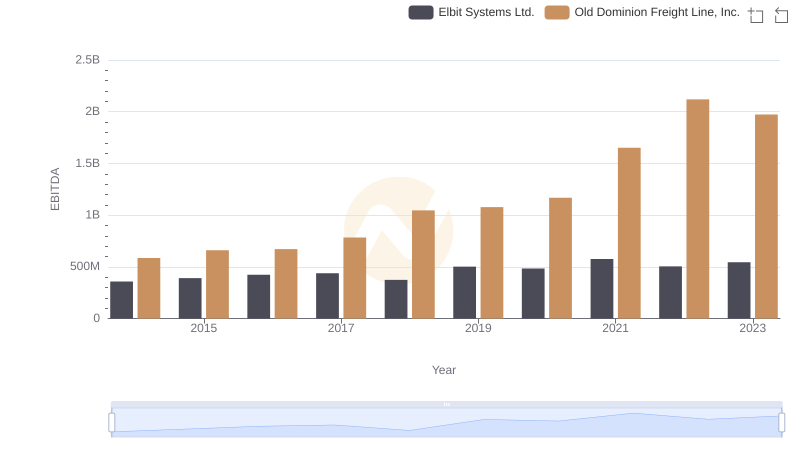
Comparative EBITDA Analysis: Old Dominion Freight Line, Inc. vs Elbit Systems Ltd.