| __timestamp | AMETEK, Inc. | Rockwell Automation, Inc. |
|---|---|---|
| Wednesday, January 1, 2014 | 462637000 | 1570100000 |
| Thursday, January 1, 2015 | 448592000 | 1506400000 |
| Friday, January 1, 2016 | 462970000 | 1467400000 |
| Sunday, January 1, 2017 | 533645000 | 1591500000 |
| Monday, January 1, 2018 | 584022000 | 1599000000 |
| Tuesday, January 1, 2019 | 610280000 | 1538500000 |
| Wednesday, January 1, 2020 | 515630000 | 1479800000 |
| Friday, January 1, 2021 | 603944000 | 1680000000 |
| Saturday, January 1, 2022 | 644577000 | 1766700000 |
| Sunday, January 1, 2023 | 677006000 | 2023700000 |
| Monday, January 1, 2024 | 696905000 | 2002600000 |
Igniting the spark of knowledge
In the ever-evolving landscape of industrial technology, AMETEK, Inc. and Rockwell Automation, Inc. have emerged as titans, each with a unique trajectory in managing their Selling, General, and Administrative (SG&A) expenses. Over the past decade, Rockwell Automation has consistently outpaced AMETEK, with SG&A expenses peaking at approximately 2 billion USD in 2023, marking a 29% increase since 2014. In contrast, AMETEK's expenses grew by about 46% over the same period, reaching nearly 677 million USD in 2023. This divergence highlights Rockwell's aggressive expansion and AMETEK's steady growth strategy. Notably, 2024 data for AMETEK is missing, leaving room for speculation on its future financial maneuvers. As these industry leaders continue to innovate, their financial strategies offer a window into their competitive dynamics and market positioning.
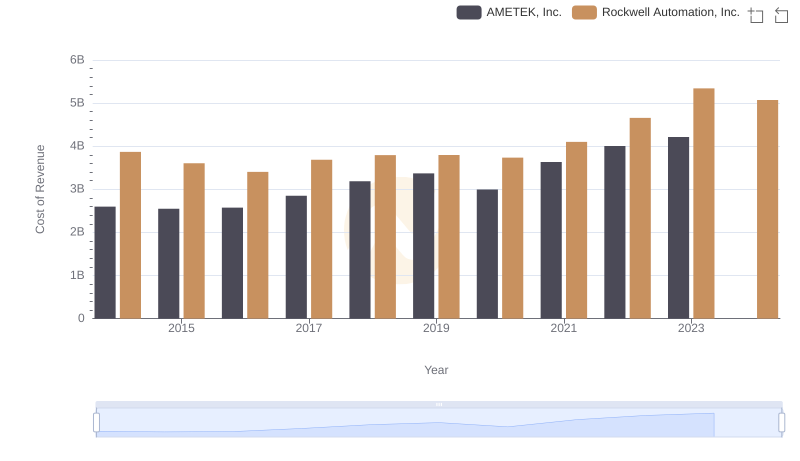
Cost of Revenue Trends: AMETEK, Inc. vs Rockwell Automation, Inc.
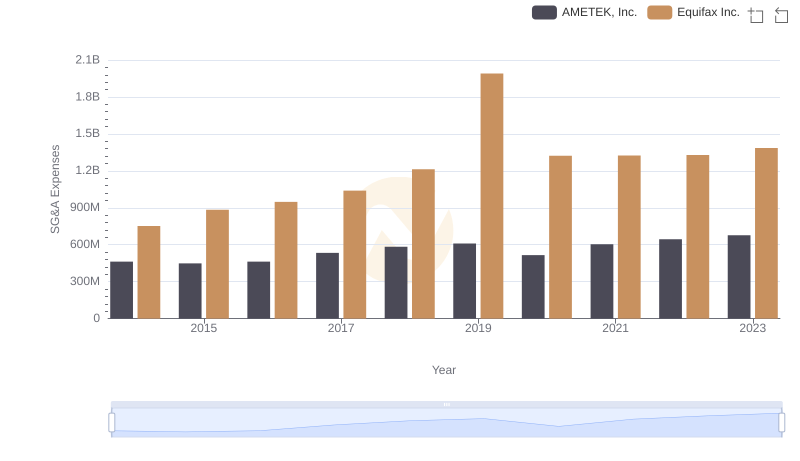
Cost Management Insights: SG&A Expenses for AMETEK, Inc. and Equifax Inc.
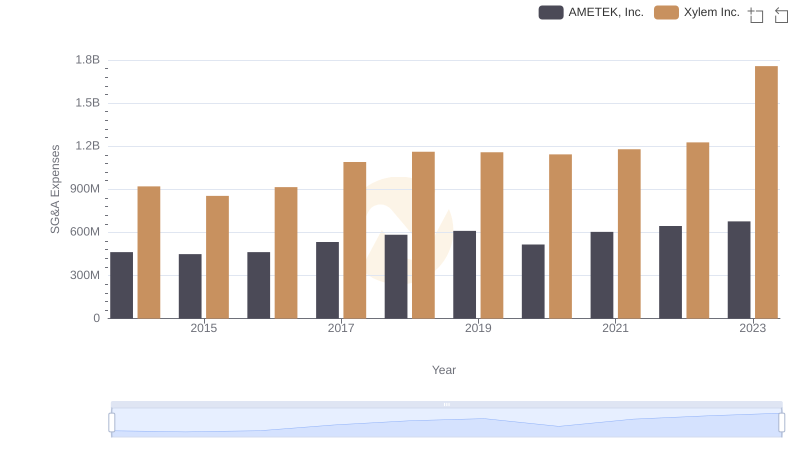
Comparing SG&A Expenses: AMETEK, Inc. vs Xylem Inc. Trends and Insights
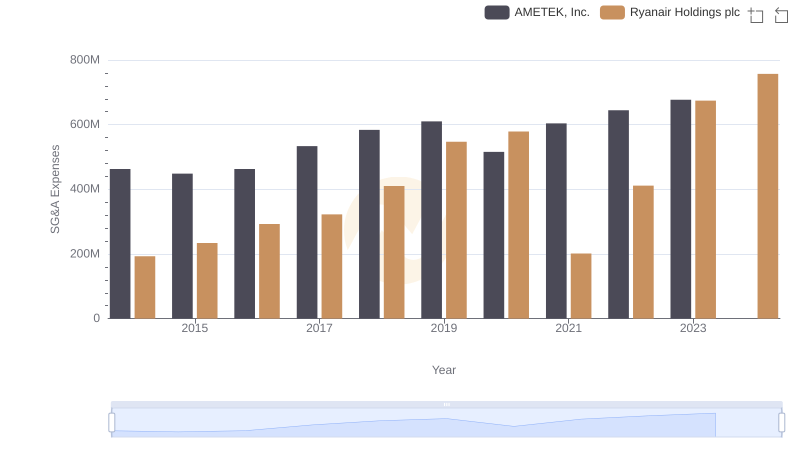
Comparing SG&A Expenses: AMETEK, Inc. vs Ryanair Holdings plc Trends and Insights
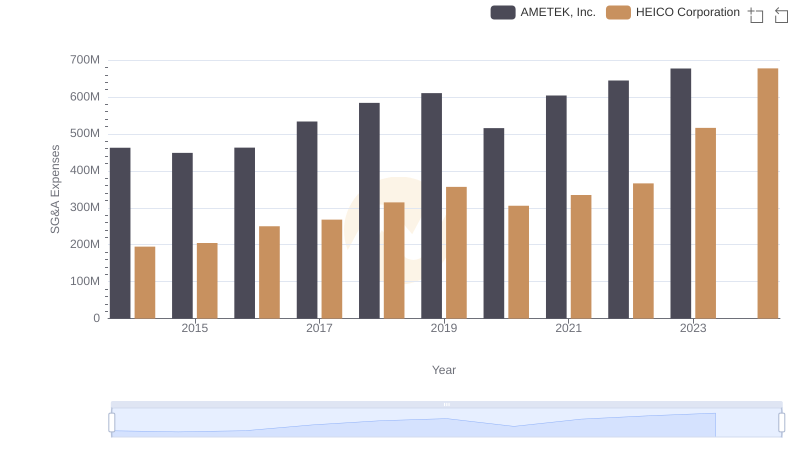
Who Optimizes SG&A Costs Better? AMETEK, Inc. or HEICO Corporation
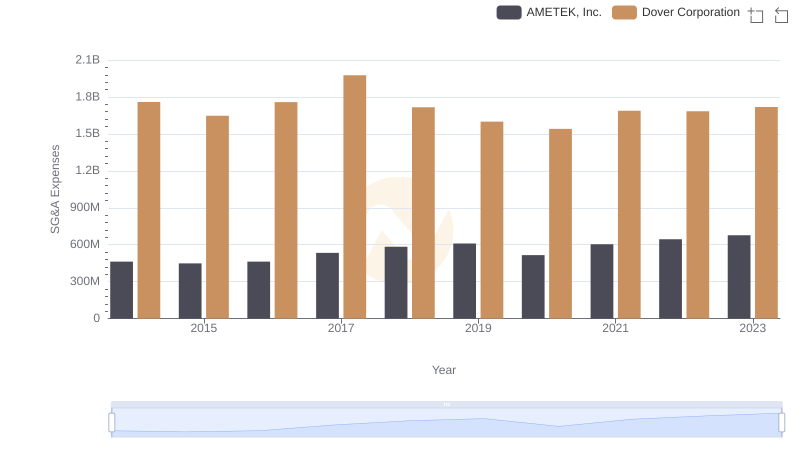
AMETEK, Inc. or Dover Corporation: Who Manages SG&A Costs Better?
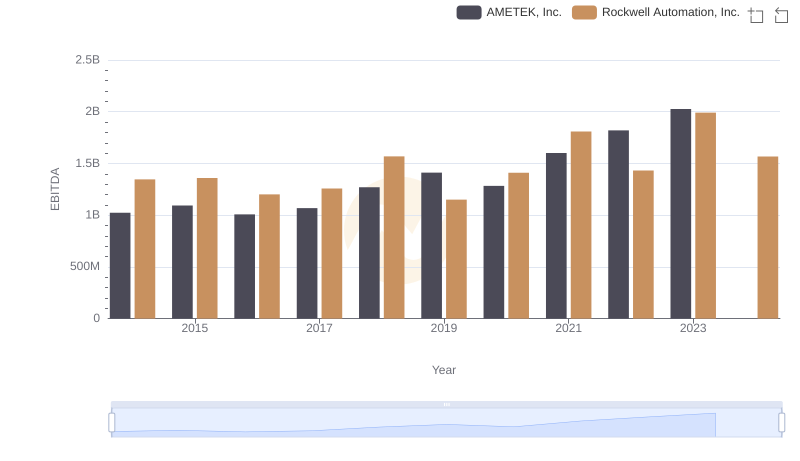
Professional EBITDA Benchmarking: AMETEK, Inc. vs Rockwell Automation, Inc.