| __timestamp | Emerson Electric Co. | Parker-Hannifin Corporation |
|---|---|---|
| Wednesday, January 1, 2014 | 10158000000 | 3027744000 |
| Thursday, January 1, 2015 | 9048000000 | 3056499000 |
| Friday, January 1, 2016 | 6262000000 | 2537369000 |
| Sunday, January 1, 2017 | 6404000000 | 2840350000 |
| Monday, January 1, 2018 | 7460000000 | 3539551000 |
| Tuesday, January 1, 2019 | 7815000000 | 3616840000 |
| Wednesday, January 1, 2020 | 7009000000 | 3409002000 |
| Friday, January 1, 2021 | 7563000000 | 3897960000 |
| Saturday, January 1, 2022 | 8188000000 | 4474341000 |
| Sunday, January 1, 2023 | 7427000000 | 6429302000 |
| Monday, January 1, 2024 | 7808000000 | 7127790000 |
Unleashing the power of data
In the ever-evolving landscape of industrial manufacturing, Parker-Hannifin Corporation and Emerson Electric Co. have been pivotal players. Over the past decade, from 2014 to 2024, these two giants have showcased contrasting trajectories in their gross profit trends. Emerson Electric Co. started strong in 2014, with a gross profit peaking at approximately $10 billion, but faced a decline of around 38% by 2016. However, they managed a recovery, stabilizing around $8 billion by 2024. In contrast, Parker-Hannifin Corporation demonstrated a remarkable growth story. From a modest $3 billion in 2014, they more than doubled their gross profit to over $7 billion by 2024, marking a significant upward trend. This comparison highlights the resilience and strategic prowess of Parker-Hannifin in navigating market challenges, while Emerson Electric's journey underscores the volatility and recovery potential in the industrial sector.
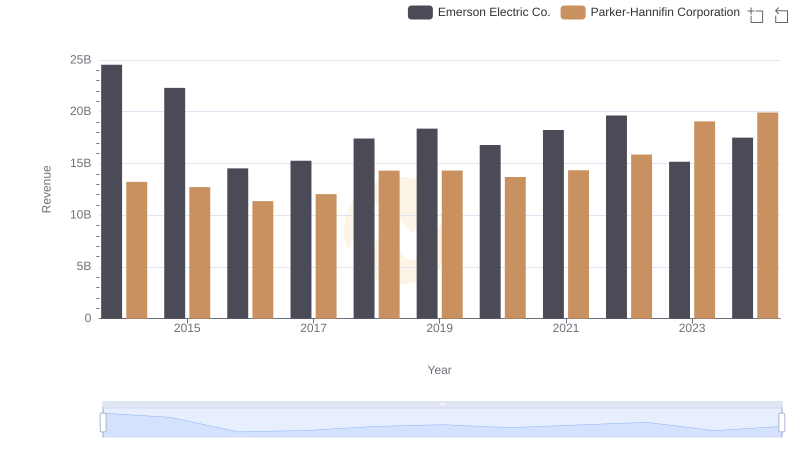
Revenue Showdown: Parker-Hannifin Corporation vs Emerson Electric Co.
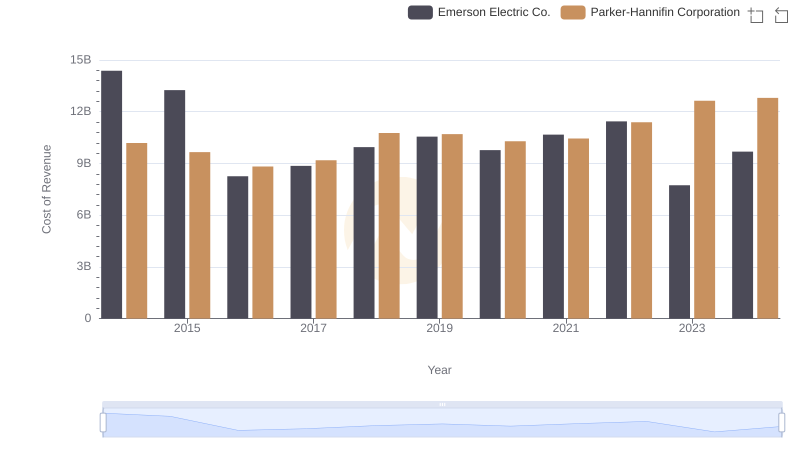
Comparing Cost of Revenue Efficiency: Parker-Hannifin Corporation vs Emerson Electric Co.

Key Insights on Gross Profit: Parker-Hannifin Corporation vs TransDigm Group Incorporated
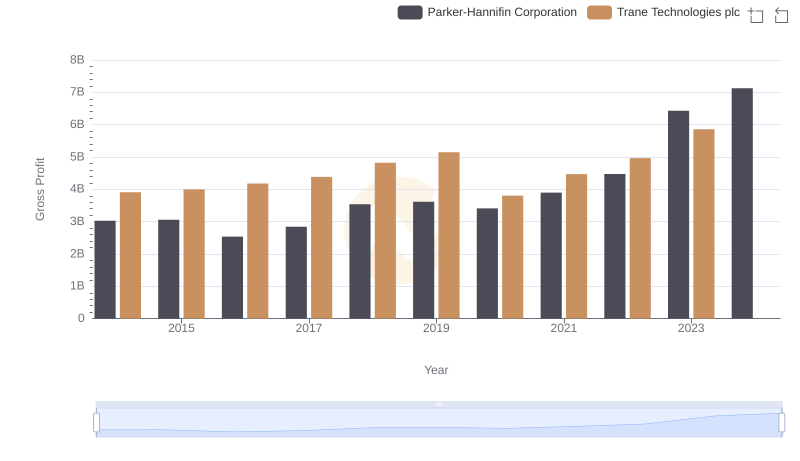
Gross Profit Analysis: Comparing Parker-Hannifin Corporation and Trane Technologies plc
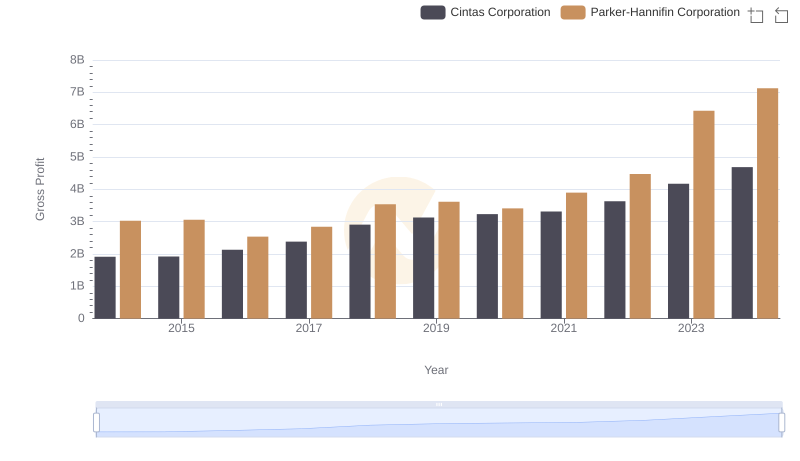
Parker-Hannifin Corporation vs Cintas Corporation: A Gross Profit Performance Breakdown
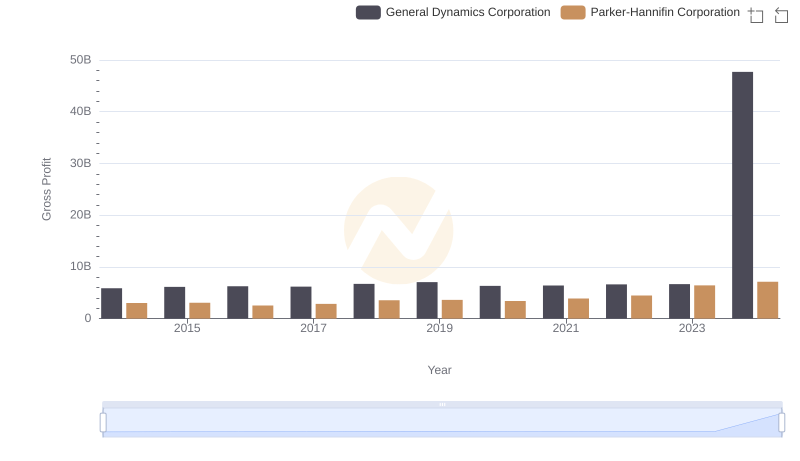
Parker-Hannifin Corporation vs General Dynamics Corporation: A Gross Profit Performance Breakdown
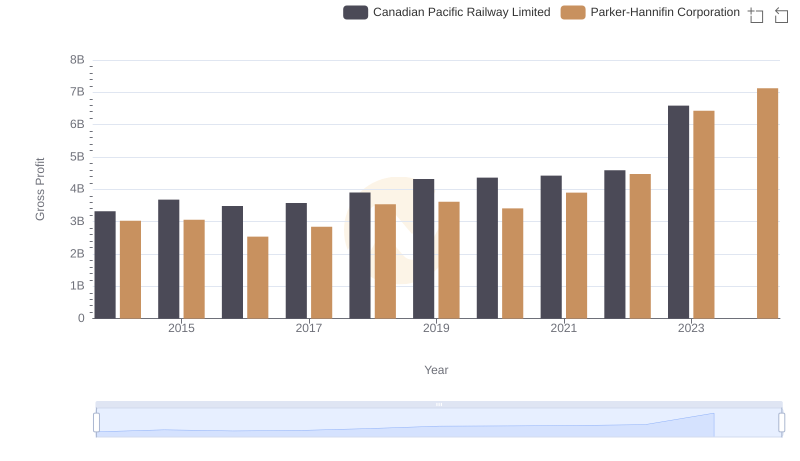
Parker-Hannifin Corporation and Canadian Pacific Railway Limited: A Detailed Gross Profit Analysis
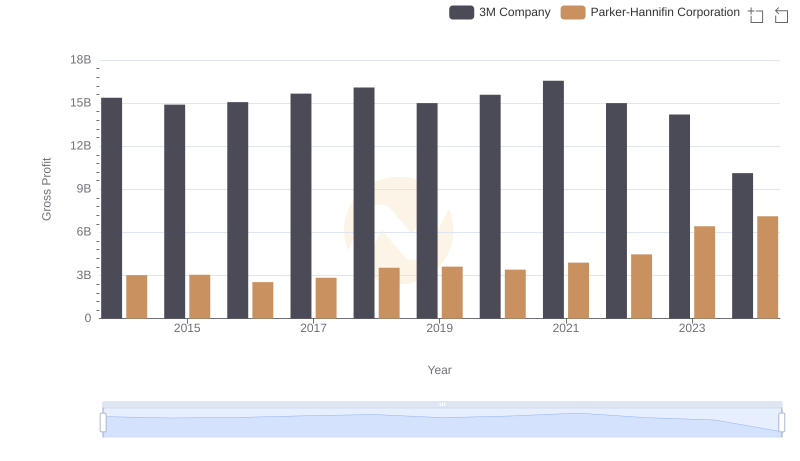
Parker-Hannifin Corporation and 3M Company: A Detailed Gross Profit Analysis
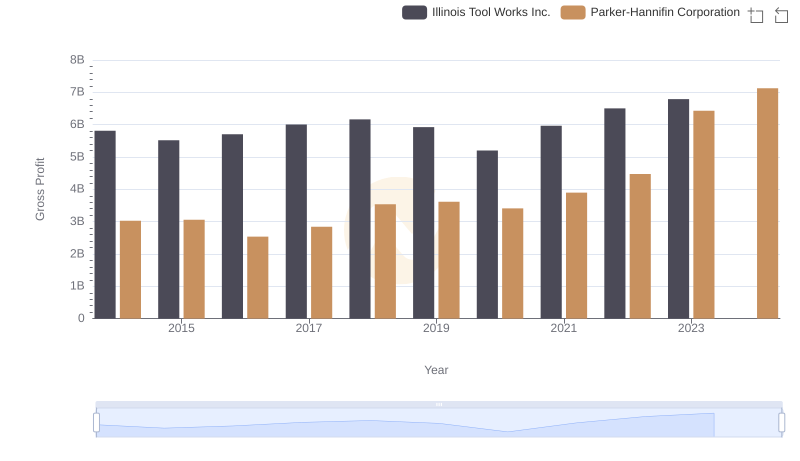
Parker-Hannifin Corporation vs Illinois Tool Works Inc.: A Gross Profit Performance Breakdown