| __timestamp | 3M Company | Parker-Hannifin Corporation |
|---|---|---|
| Wednesday, January 1, 2014 | 15374000000 | 3027744000 |
| Thursday, January 1, 2015 | 14891000000 | 3056499000 |
| Friday, January 1, 2016 | 15069000000 | 2537369000 |
| Sunday, January 1, 2017 | 15656000000 | 2840350000 |
| Monday, January 1, 2018 | 16083000000 | 3539551000 |
| Tuesday, January 1, 2019 | 15000000000 | 3616840000 |
| Wednesday, January 1, 2020 | 15579000000 | 3409002000 |
| Friday, January 1, 2021 | 16560000000 | 3897960000 |
| Saturday, January 1, 2022 | 14997000000 | 4474341000 |
| Sunday, January 1, 2023 | 14204000000 | 6429302000 |
| Monday, January 1, 2024 | 10128000000 | 7127790000 |
Cracking the code
In the ever-evolving landscape of industrial manufacturing, Parker-Hannifin Corporation and 3M Company stand as titans. Over the past decade, these companies have showcased contrasting trajectories in gross profit. From 2014 to 2024, 3M's gross profit peaked in 2021, reaching approximately 16.56 billion, before experiencing a decline to around 10.13 billion in 2024. This represents a significant drop of nearly 39% over three years. Meanwhile, Parker-Hannifin has demonstrated a robust upward trend, with its gross profit surging from 3.03 billion in 2014 to an impressive 7.13 billion in 2024, marking a growth of over 135%.
This analysis highlights the dynamic shifts within the industrial sector, where adaptability and innovation are key. As 3M navigates its challenges, Parker-Hannifin's strategic advancements position it as a formidable competitor. The coming years will be pivotal in determining the future landscape of these industry leaders.
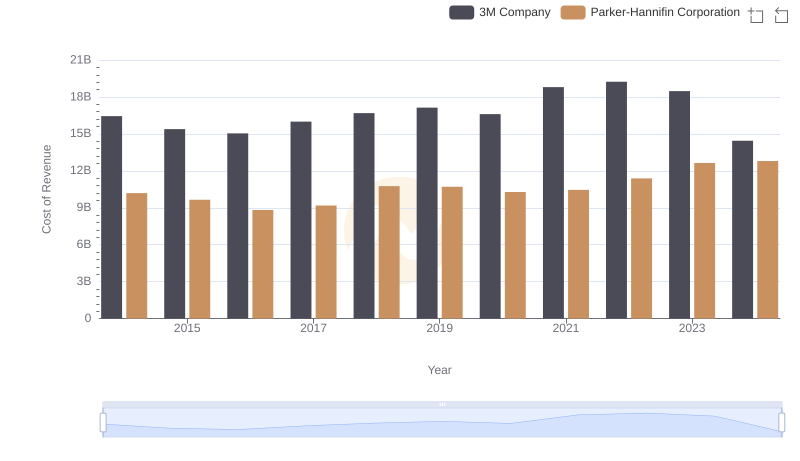
Parker-Hannifin Corporation vs 3M Company: Efficiency in Cost of Revenue Explored

Key Insights on Gross Profit: Parker-Hannifin Corporation vs TransDigm Group Incorporated
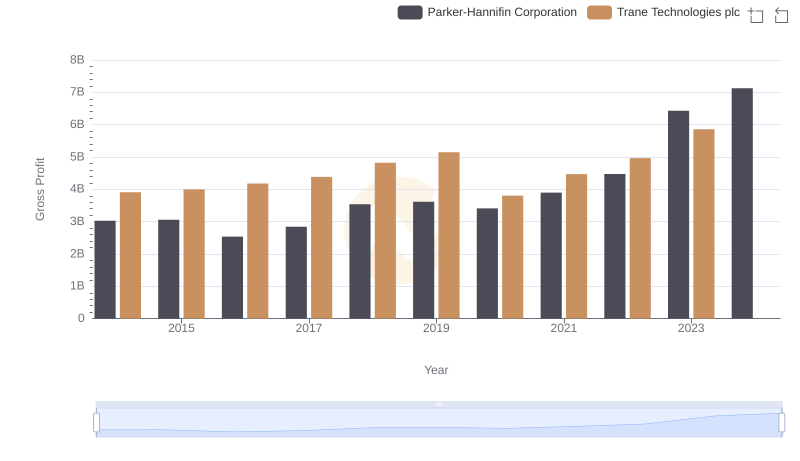
Gross Profit Analysis: Comparing Parker-Hannifin Corporation and Trane Technologies plc
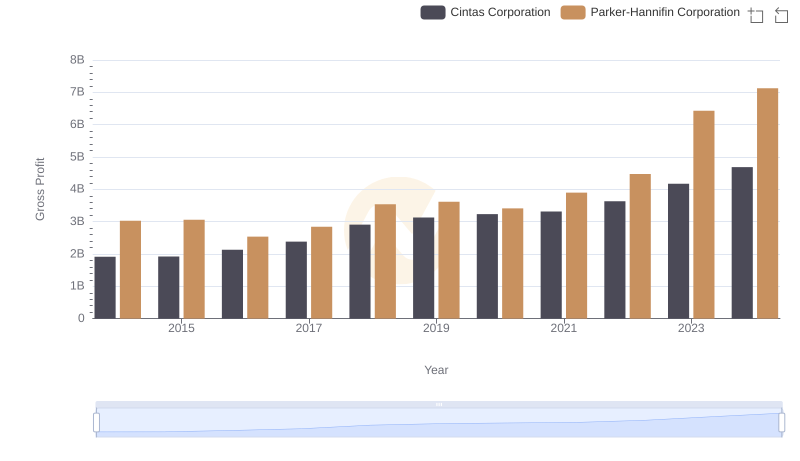
Parker-Hannifin Corporation vs Cintas Corporation: A Gross Profit Performance Breakdown
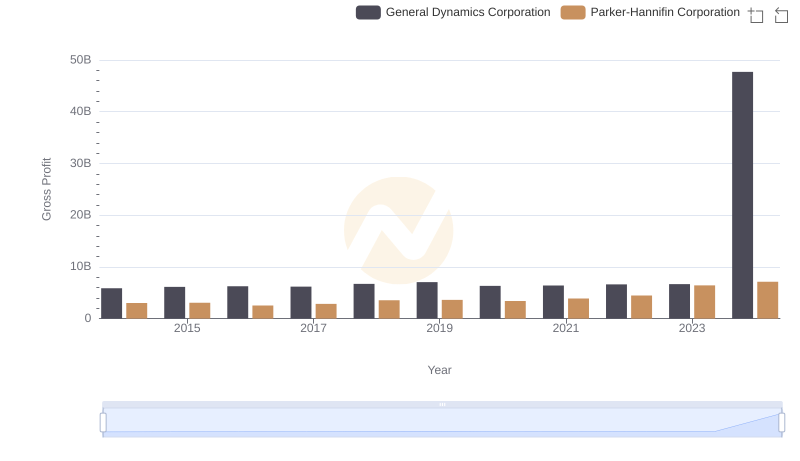
Parker-Hannifin Corporation vs General Dynamics Corporation: A Gross Profit Performance Breakdown
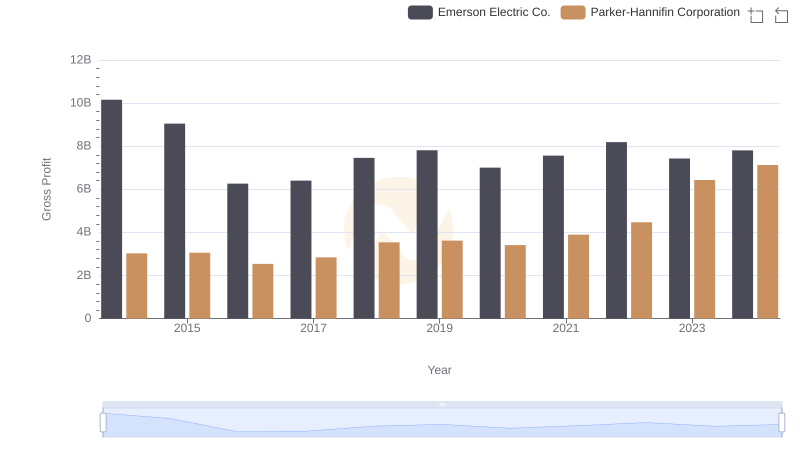
Gross Profit Trends Compared: Parker-Hannifin Corporation vs Emerson Electric Co.
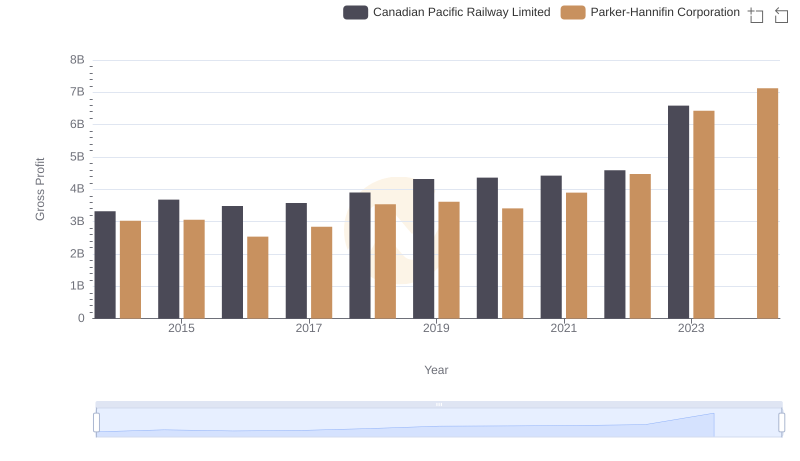
Parker-Hannifin Corporation and Canadian Pacific Railway Limited: A Detailed Gross Profit Analysis
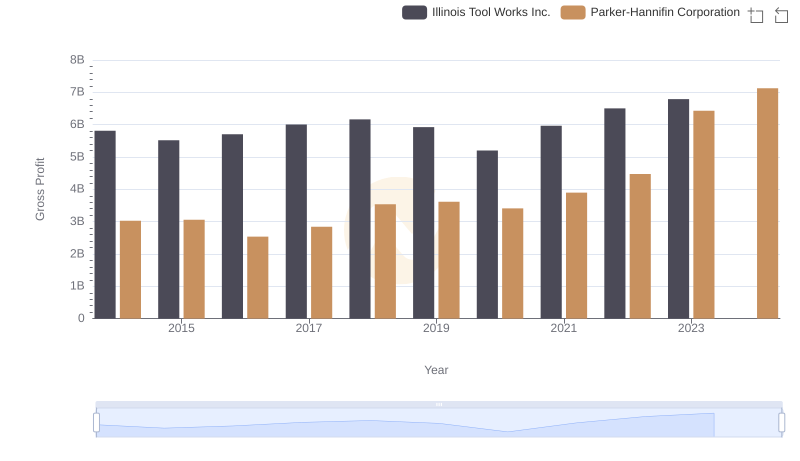
Parker-Hannifin Corporation vs Illinois Tool Works Inc.: A Gross Profit Performance Breakdown
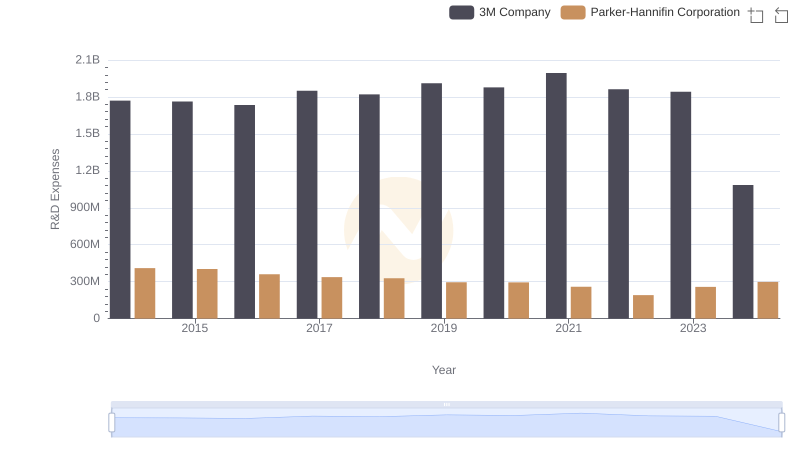
Parker-Hannifin Corporation or 3M Company: Who Invests More in Innovation?
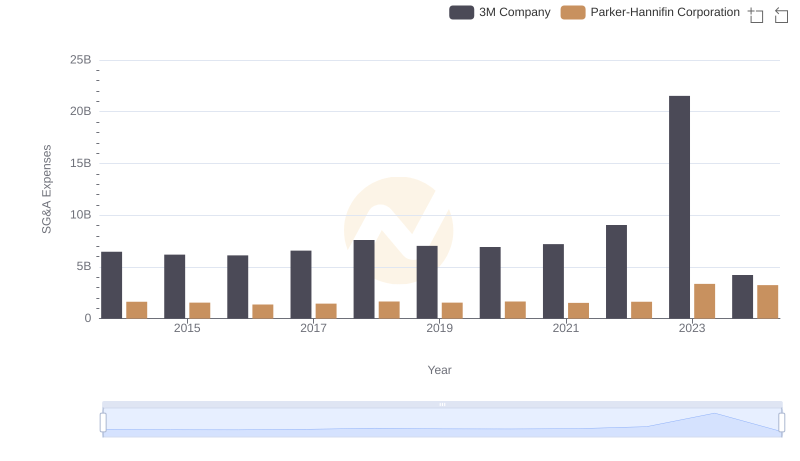
Parker-Hannifin Corporation and 3M Company: SG&A Spending Patterns Compared