| __timestamp | Builders FirstSource, Inc. | Parker-Hannifin Corporation |
|---|---|---|
| Wednesday, January 1, 2014 | 306508000 | 1633992000 |
| Thursday, January 1, 2015 | 810841000 | 1544746000 |
| Friday, January 1, 2016 | 1360412000 | 1359360000 |
| Sunday, January 1, 2017 | 1442288000 | 1453935000 |
| Monday, January 1, 2018 | 1553972000 | 1657152000 |
| Tuesday, January 1, 2019 | 1584523000 | 1543939000 |
| Wednesday, January 1, 2020 | 1678730000 | 1656553000 |
| Friday, January 1, 2021 | 3463532000 | 1527302000 |
| Saturday, January 1, 2022 | 3974173000 | 1627116000 |
| Sunday, January 1, 2023 | 3836015000 | 3354103000 |
| Monday, January 1, 2024 | 3315177000 |
Unlocking the unknown
In the ever-evolving landscape of corporate finance, understanding the trends in Selling, General, and Administrative (SG&A) expenses is crucial for investors and analysts alike. This chart provides a comparative analysis of SG&A expenses for Parker-Hannifin Corporation and Builders FirstSource, Inc. from 2014 to 2023.
Parker-Hannifin Corporation, a leader in motion and control technologies, maintained a relatively stable SG&A expense trend, with a notable spike in 2023, reaching approximately 3.35 billion. This represents a significant increase of over 100% compared to its 2014 figures. On the other hand, Builders FirstSource, Inc., a major supplier of building materials, saw a dramatic rise in SG&A expenses, peaking in 2022 at nearly 4 billion, a staggering 1,200% increase from 2014.
While the data for 2024 is incomplete for Builders FirstSource, the trends observed provide valuable insights into the financial strategies of these industry giants.
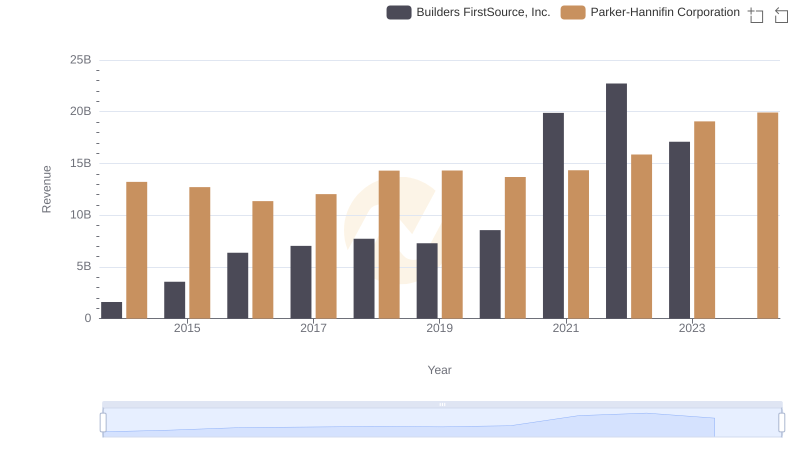
Annual Revenue Comparison: Parker-Hannifin Corporation vs Builders FirstSource, Inc.

Analyzing Cost of Revenue: Parker-Hannifin Corporation and Builders FirstSource, Inc.
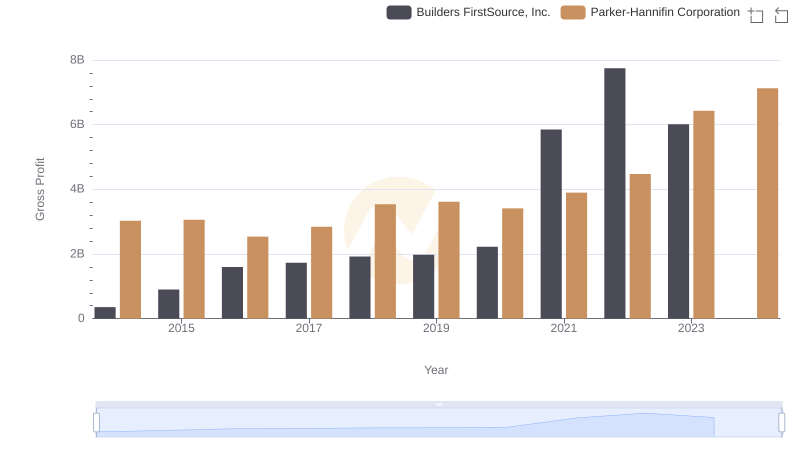
Parker-Hannifin Corporation and Builders FirstSource, Inc.: A Detailed Gross Profit Analysis
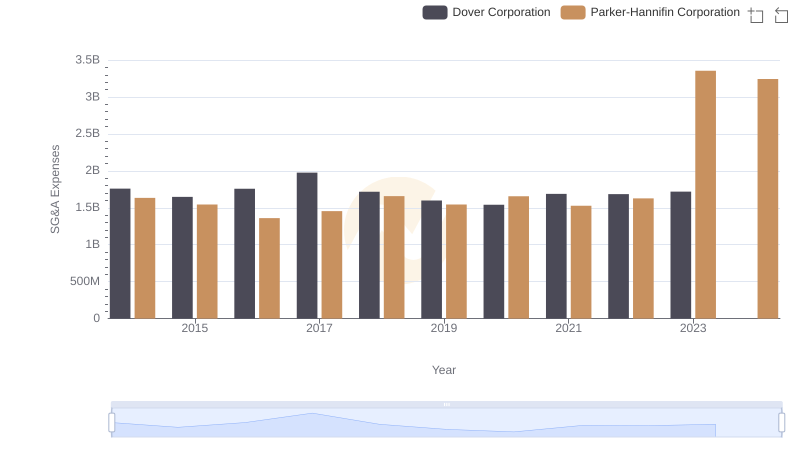
Parker-Hannifin Corporation and Dover Corporation: SG&A Spending Patterns Compared
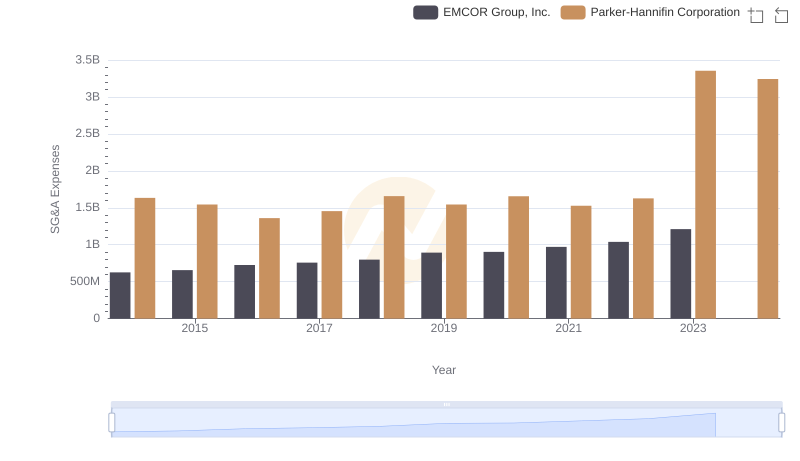
Who Optimizes SG&A Costs Better? Parker-Hannifin Corporation or EMCOR Group, Inc.
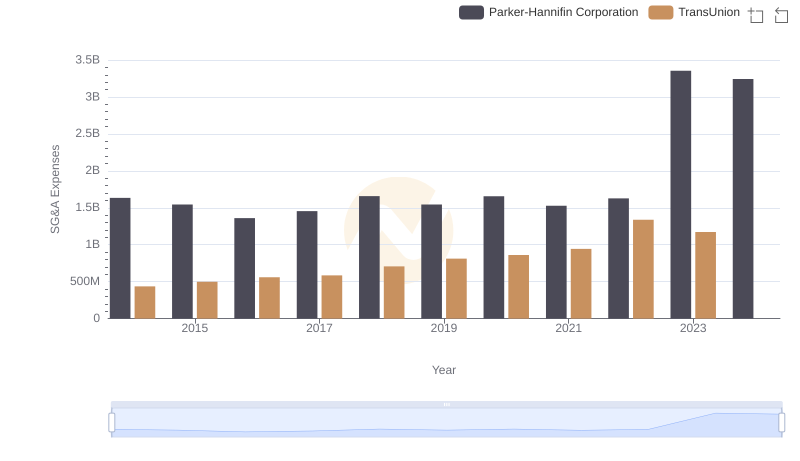
Selling, General, and Administrative Costs: Parker-Hannifin Corporation vs TransUnion
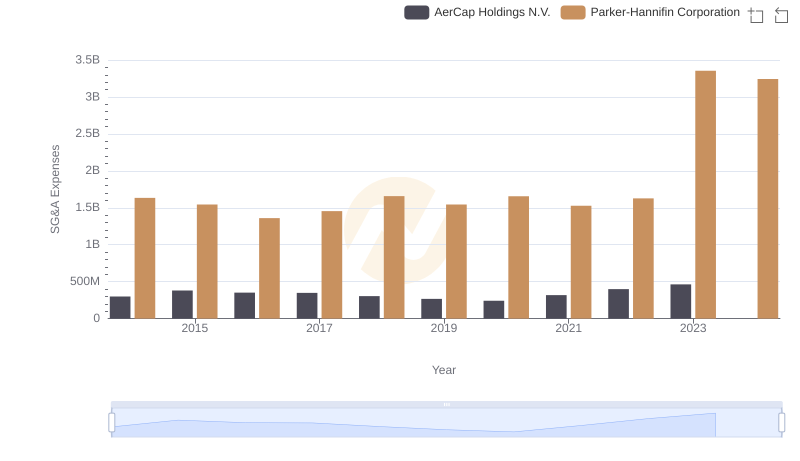
Who Optimizes SG&A Costs Better? Parker-Hannifin Corporation or AerCap Holdings N.V.