| __timestamp | Expeditors International of Washington, Inc. | Parker-Hannifin Corporation |
|---|---|---|
| Wednesday, January 1, 2014 | 643940000 | 1832903000 |
| Thursday, January 1, 2015 | 767496000 | 1861551000 |
| Friday, January 1, 2016 | 716959000 | 1558088000 |
| Sunday, January 1, 2017 | 749570000 | 1846306000 |
| Monday, January 1, 2018 | 850582000 | 2382235000 |
| Tuesday, January 1, 2019 | 817642000 | 2513468000 |
| Wednesday, January 1, 2020 | 1013523000 | 2431500000 |
| Friday, January 1, 2021 | 1975928000 | 3092383000 |
| Saturday, January 1, 2022 | 1916506000 | 2441242000 |
| Sunday, January 1, 2023 | 1087588000 | 4071687000 |
| Monday, January 1, 2024 | 1154330000 | 5028229000 |
Unleashing the power of data
In the ever-evolving landscape of industrial and logistics sectors, understanding financial health is crucial. This analysis delves into the EBITDA performance of Parker-Hannifin Corporation and Expeditors International of Washington, Inc. from 2014 to 2023. Parker-Hannifin, a leader in motion and control technologies, consistently outperformed Expeditors, a global logistics company, with an average EBITDA nearly 150% higher. Notably, Parker-Hannifin's EBITDA surged by 122% from 2014 to 2023, peaking in 2023, while Expeditors saw a 69% increase, with its highest EBITDA in 2021. The data highlights Parker-Hannifin's robust growth trajectory, especially in 2023, despite missing data for Expeditors in 2024. This trend underscores the resilience and strategic prowess of Parker-Hannifin in navigating market challenges, offering valuable insights for investors and industry analysts alike.

Revenue Insights: Parker-Hannifin Corporation and Expeditors International of Washington, Inc. Performance Compared
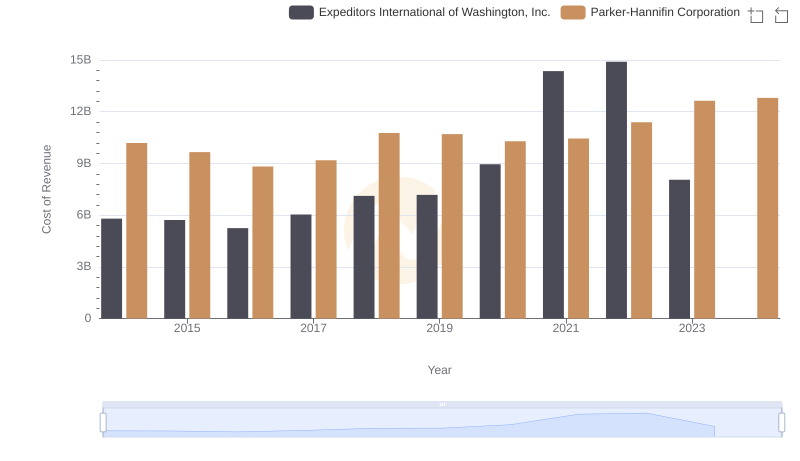
Cost of Revenue: Key Insights for Parker-Hannifin Corporation and Expeditors International of Washington, Inc.
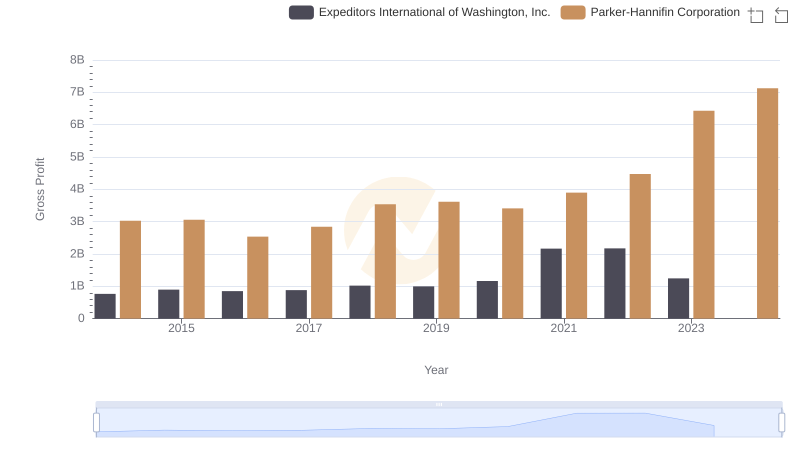
Gross Profit Trends Compared: Parker-Hannifin Corporation vs Expeditors International of Washington, Inc.
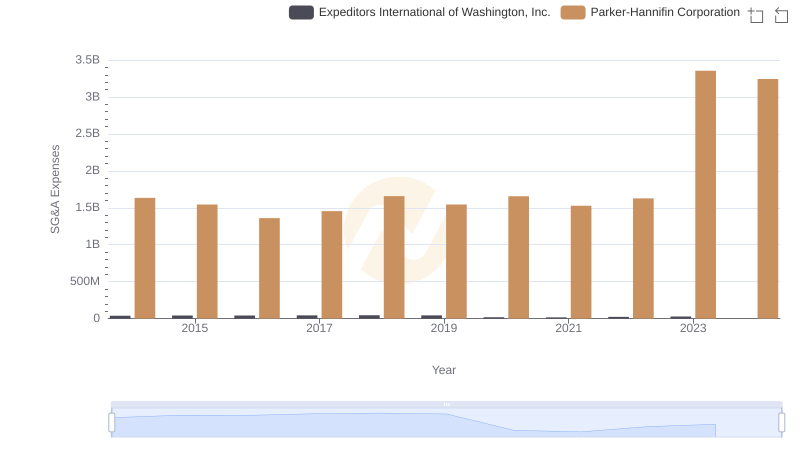
Who Optimizes SG&A Costs Better? Parker-Hannifin Corporation or Expeditors International of Washington, Inc.
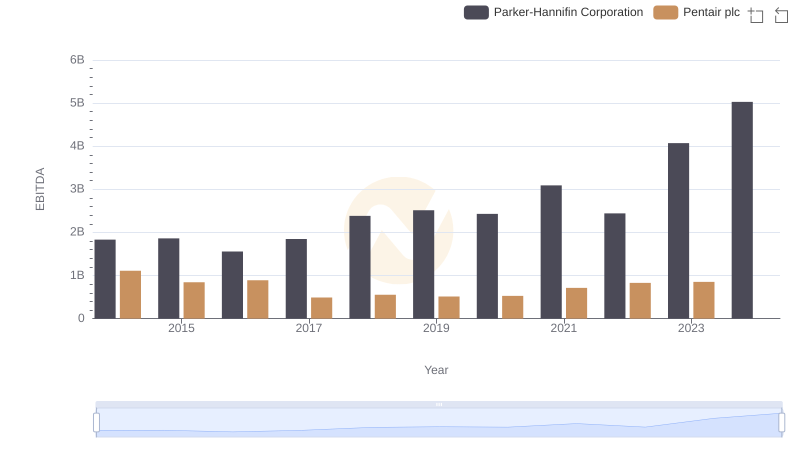
EBITDA Metrics Evaluated: Parker-Hannifin Corporation vs Pentair plc
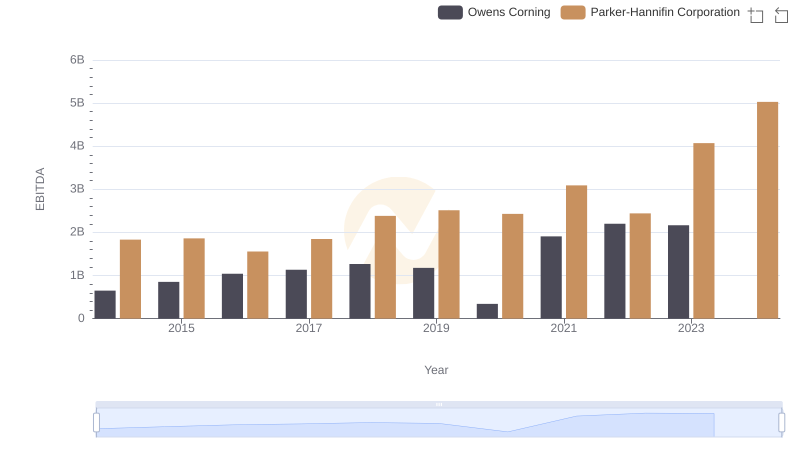
Parker-Hannifin Corporation and Owens Corning: A Detailed Examination of EBITDA Performance
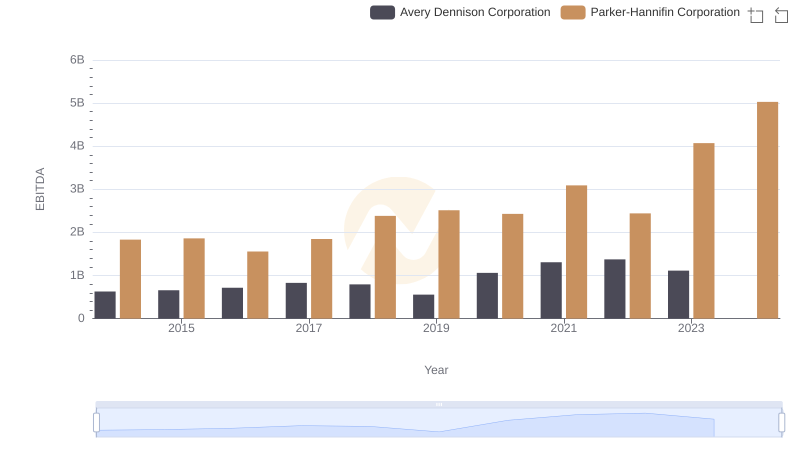
EBITDA Metrics Evaluated: Parker-Hannifin Corporation vs Avery Dennison Corporation
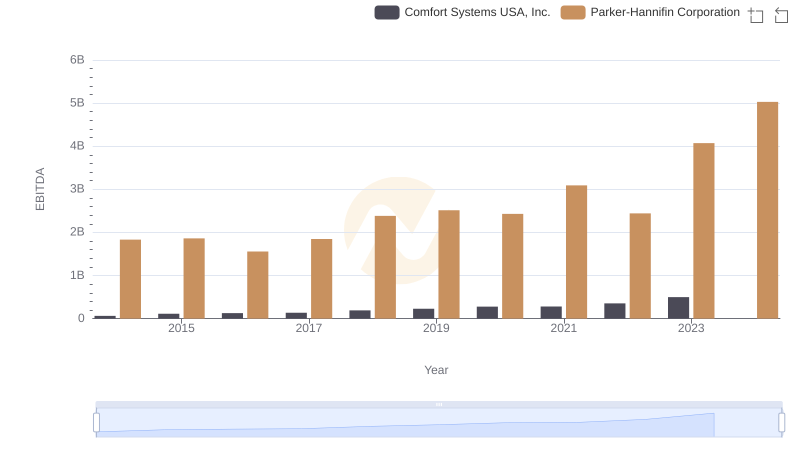
Parker-Hannifin Corporation and Comfort Systems USA, Inc.: A Detailed Examination of EBITDA Performance
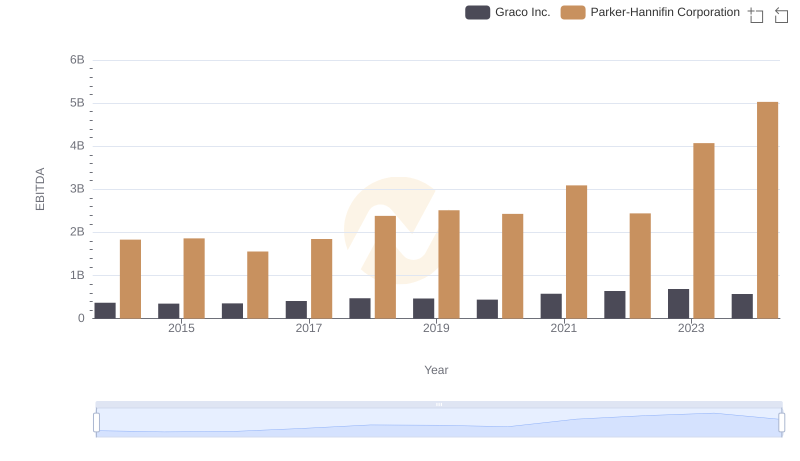
EBITDA Analysis: Evaluating Parker-Hannifin Corporation Against Graco Inc.