| __timestamp | Ryanair Holdings plc | Stanley Black & Decker, Inc. |
|---|---|---|
| Wednesday, January 1, 2014 | 192800000 | 2595900000 |
| Thursday, January 1, 2015 | 233900000 | 2486400000 |
| Friday, January 1, 2016 | 292700000 | 2623900000 |
| Sunday, January 1, 2017 | 322300000 | 2980100000 |
| Monday, January 1, 2018 | 410400000 | 3171700000 |
| Tuesday, January 1, 2019 | 547300000 | 3041000000 |
| Wednesday, January 1, 2020 | 578800000 | 3089600000 |
| Friday, January 1, 2021 | 201500000 | 3240400000 |
| Saturday, January 1, 2022 | 411300000 | 3370000000 |
| Sunday, January 1, 2023 | 674400000 | 2829300000 |
| Monday, January 1, 2024 | 757200000 | 3310500000 |
Infusing magic into the data realm
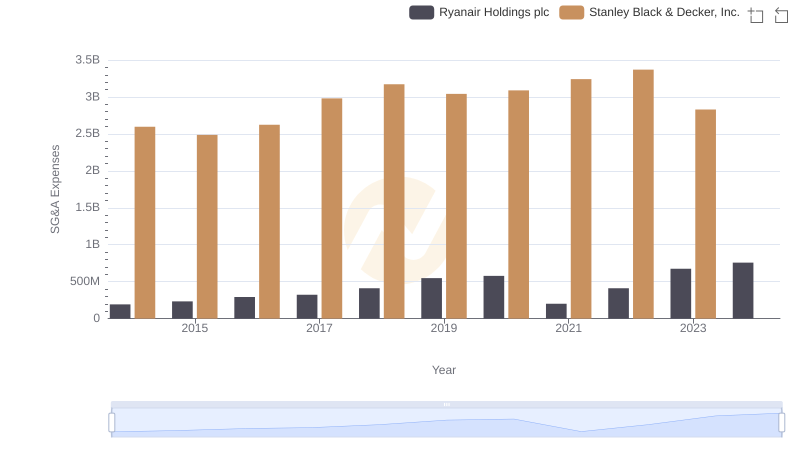
In the world of corporate finance, understanding operational costs is crucial for evaluating a company's efficiency. This analysis delves into the Selling, General, and Administrative (SG&A) expenses of two industry titans: Ryanair Holdings plc and Stanley Black & Decker, Inc., from 2014 to 2023.
Ryanair, Europe's largest low-cost airline, has seen its SG&A expenses rise steadily over the years. From 2014 to 2023, Ryanair's expenses increased by approximately 292%, peaking in 2023. This growth reflects the airline's expansion and increased operational activities.
In contrast, Stanley Black & Decker, a leader in tools and storage, displayed a more stable yet fluctuating SG&A pattern. Despite a peak in 2022, their expenses saw a slight dip in 2023, indicating potential cost optimization strategies.
This comparative analysis highlights the diverse financial strategies of these two companies, offering insights into their operational efficiencies and market strategies.
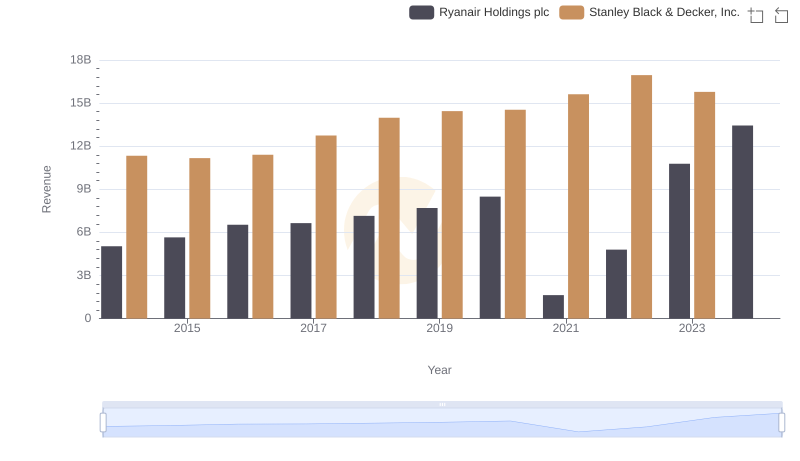
Annual Revenue Comparison: Ryanair Holdings plc vs Stanley Black & Decker, Inc.
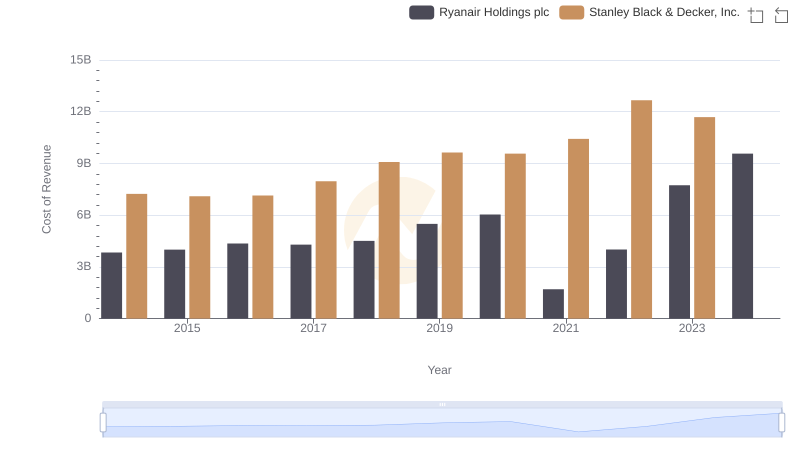
Cost of Revenue Trends: Ryanair Holdings plc vs Stanley Black & Decker, Inc.

Breaking Down SG&A Expenses: Ryanair Holdings plc vs Southwest Airlines Co.
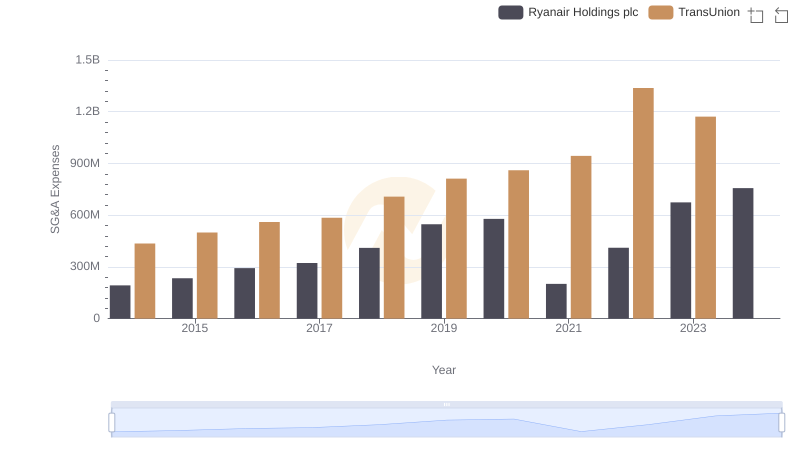
Comparing SG&A Expenses: Ryanair Holdings plc vs TransUnion Trends and Insights
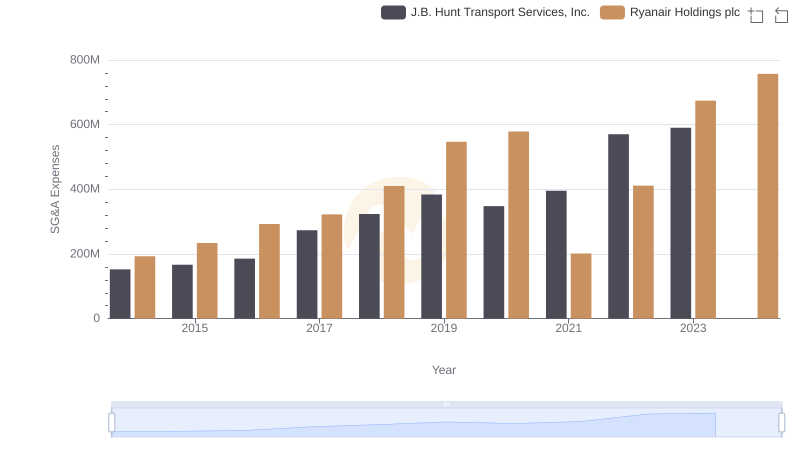
Selling, General, and Administrative Costs: Ryanair Holdings plc vs J.B. Hunt Transport Services, Inc.
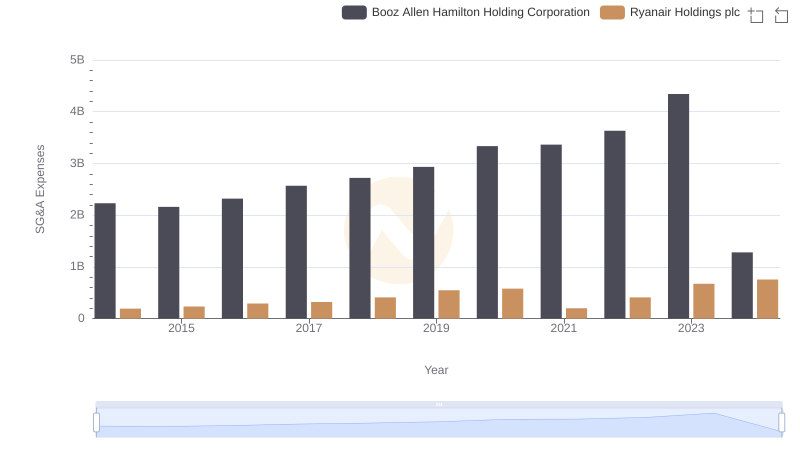
Cost Management Insights: SG&A Expenses for Ryanair Holdings plc and Booz Allen Hamilton Holding Corporation
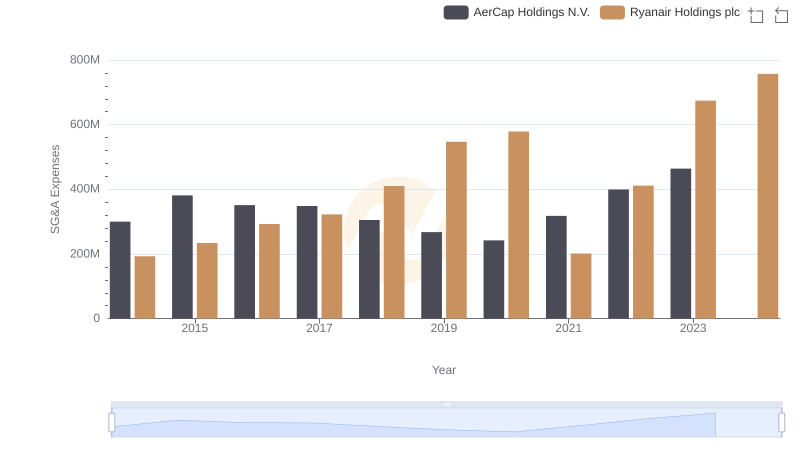
Ryanair Holdings plc and AerCap Holdings N.V.: SG&A Spending Patterns Compared
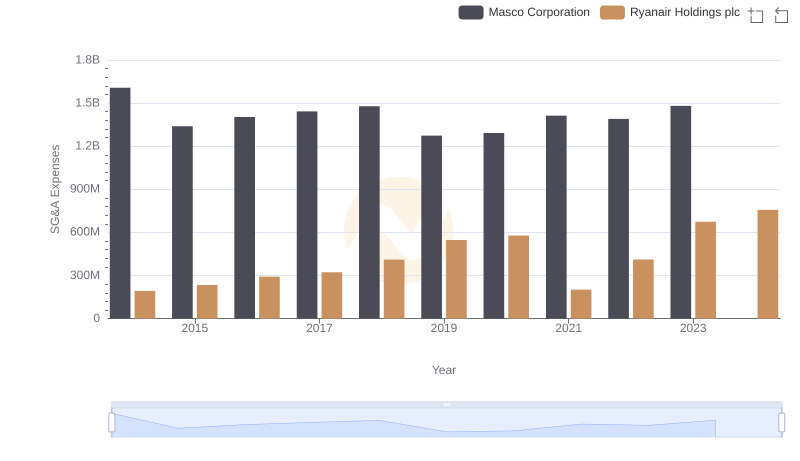
Cost Management Insights: SG&A Expenses for Ryanair Holdings plc and Masco Corporation
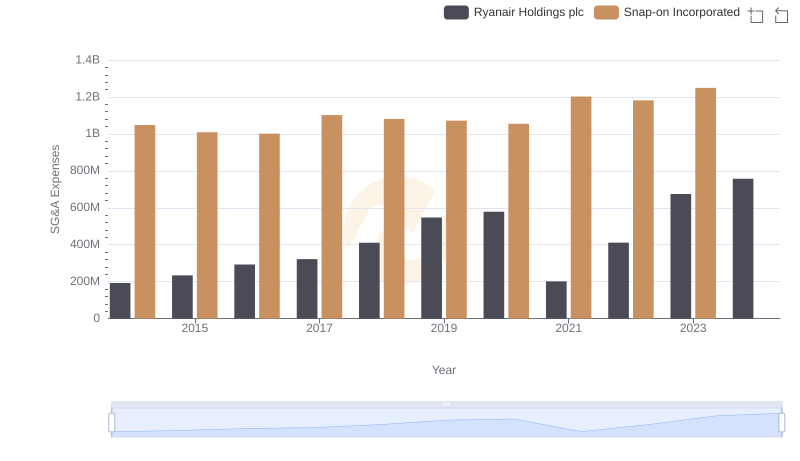
Comparing SG&A Expenses: Ryanair Holdings plc vs Snap-on Incorporated Trends and Insights

Ryanair Holdings plc or Stanley Black & Decker, Inc.: Who Leads in Yearly Revenue?

Cost of Revenue Comparison: Ryanair Holdings plc vs Stanley Black & Decker, Inc.
SG&A Efficiency Analysis: Comparing Ryanair Holdings plc and Stanley Black & Decker, Inc.