| __timestamp | Ryanair Holdings plc | TransUnion |
|---|---|---|
| Wednesday, January 1, 2014 | 192800000 | 436000000 |
| Thursday, January 1, 2015 | 233900000 | 499700000 |
| Friday, January 1, 2016 | 292700000 | 560100000 |
| Sunday, January 1, 2017 | 322300000 | 585400000 |
| Monday, January 1, 2018 | 410400000 | 707700000 |
| Tuesday, January 1, 2019 | 547300000 | 812100000 |
| Wednesday, January 1, 2020 | 578800000 | 860300000 |
| Friday, January 1, 2021 | 201500000 | 943900000 |
| Saturday, January 1, 2022 | 411300000 | 1337400000 |
| Sunday, January 1, 2023 | 674400000 | 1171600000 |
| Monday, January 1, 2024 | 757200000 | 1239300000 |
Unveiling the hidden dimensions of data
In the ever-evolving landscape of corporate finance, understanding the trends in Selling, General, and Administrative (SG&A) expenses can offer valuable insights into a company's operational efficiency. From 2014 to 2023, Ryanair Holdings plc and TransUnion have shown distinct trajectories in their SG&A expenses. Ryanair's expenses have surged by approximately 292%, peaking in 2023, while TransUnion's expenses have increased by about 169% over the same period, reaching their zenith in 2022. Notably, Ryanair experienced a significant dip in 2021, reflecting potential strategic shifts or external challenges. Meanwhile, TransUnion's consistent growth underscores its expanding operational footprint. As we look to 2024, Ryanair's data remains robust, while TransUnion's figures are yet to be revealed, leaving room for speculation on future trends. This comparative analysis not only highlights the financial strategies of these giants but also offers a window into their adaptive business models.
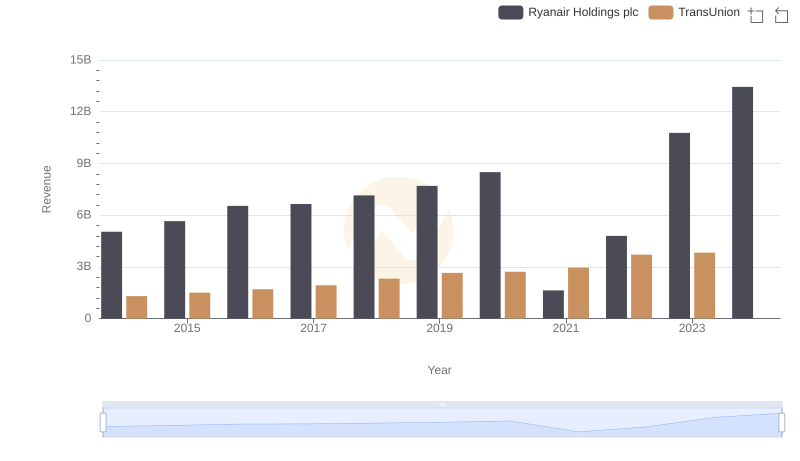
Ryanair Holdings plc or TransUnion: Who Leads in Yearly Revenue?
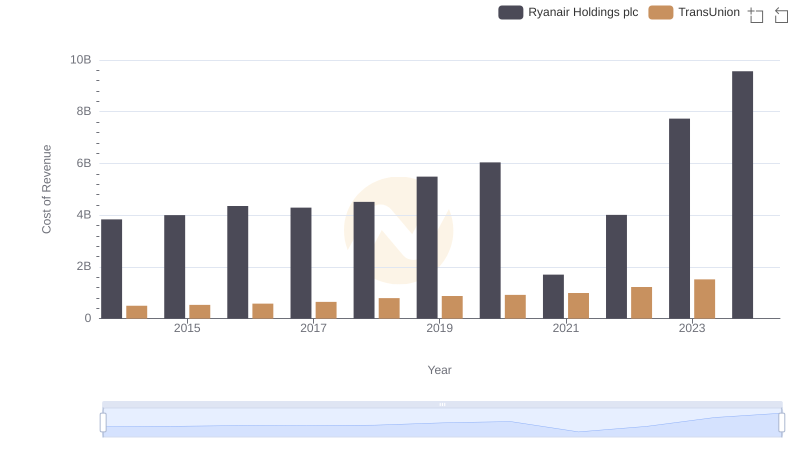
Ryanair Holdings plc vs TransUnion: Efficiency in Cost of Revenue Explored

Breaking Down SG&A Expenses: Ryanair Holdings plc vs Southwest Airlines Co.
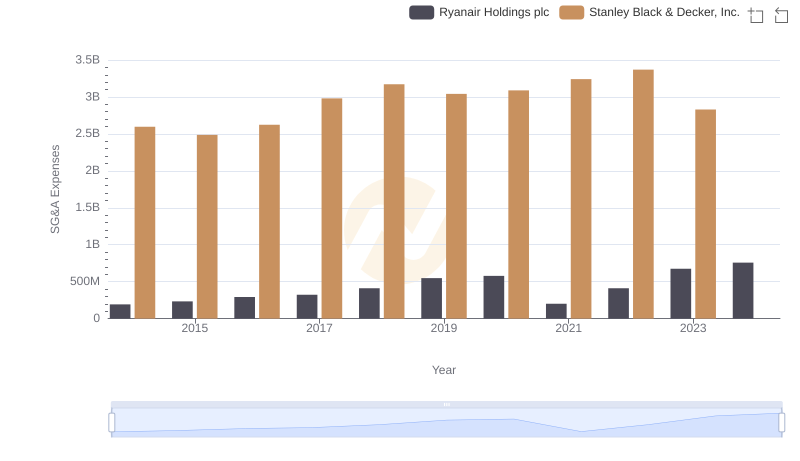
Operational Costs Compared: SG&A Analysis of Ryanair Holdings plc and Stanley Black & Decker, Inc.
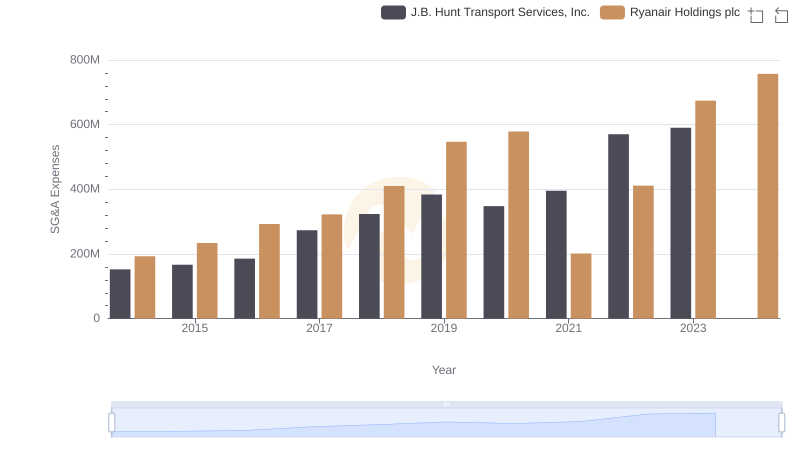
Selling, General, and Administrative Costs: Ryanair Holdings plc vs J.B. Hunt Transport Services, Inc.
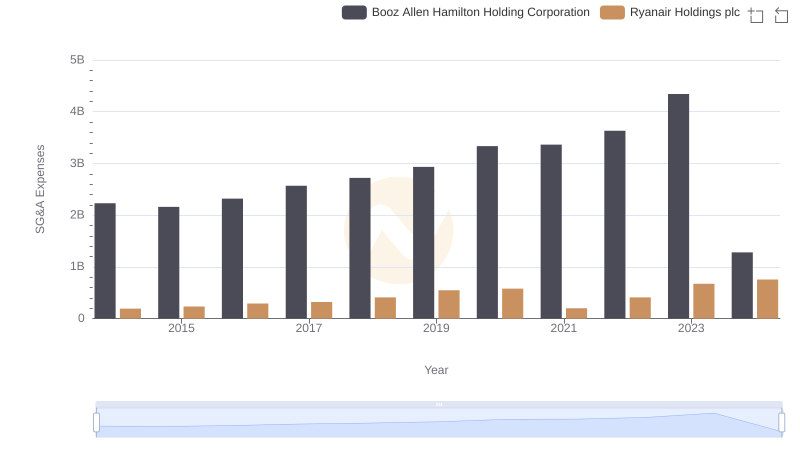
Cost Management Insights: SG&A Expenses for Ryanair Holdings plc and Booz Allen Hamilton Holding Corporation
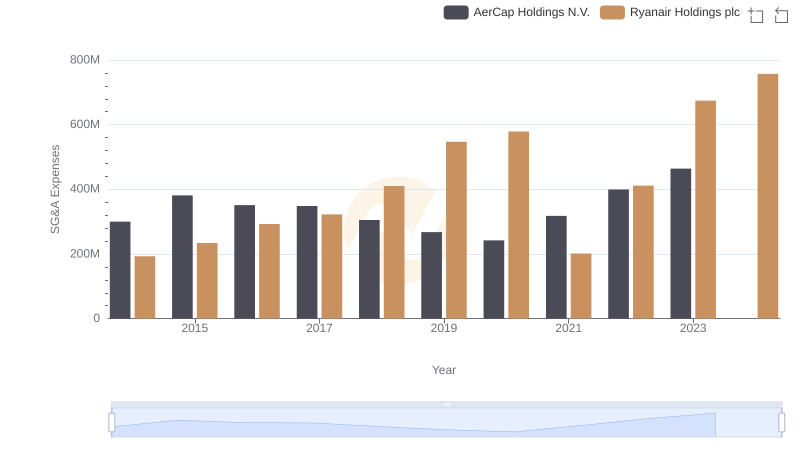
Ryanair Holdings plc and AerCap Holdings N.V.: SG&A Spending Patterns Compared
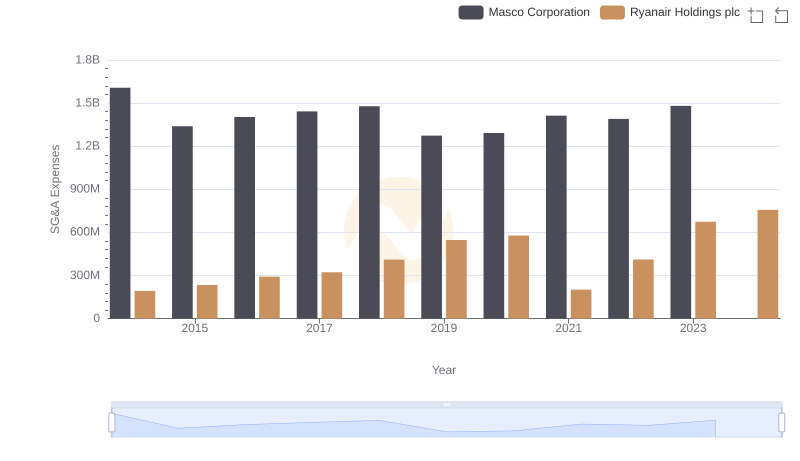
Cost Management Insights: SG&A Expenses for Ryanair Holdings plc and Masco Corporation
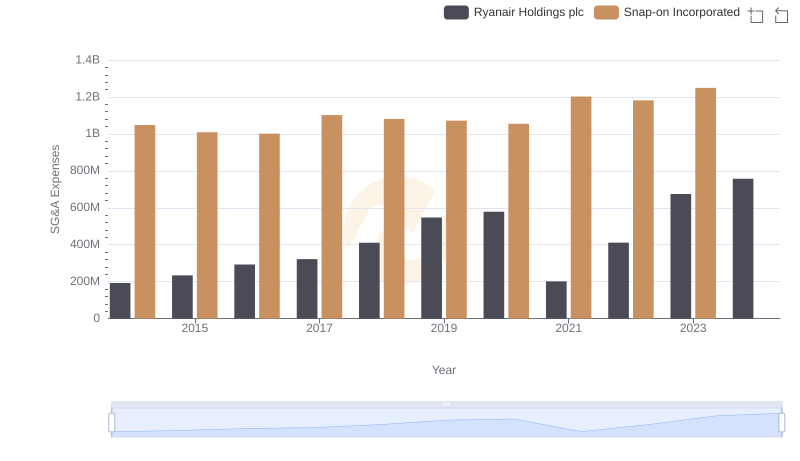
Comparing SG&A Expenses: Ryanair Holdings plc vs Snap-on Incorporated Trends and Insights
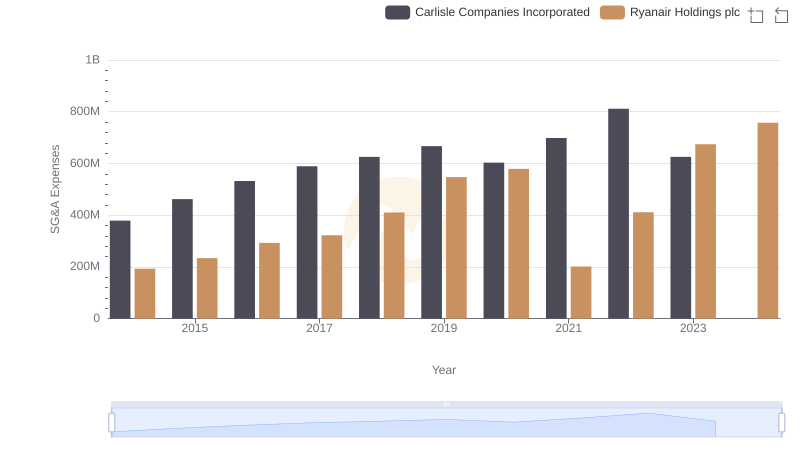
Selling, General, and Administrative Costs: Ryanair Holdings plc vs Carlisle Companies Incorporated
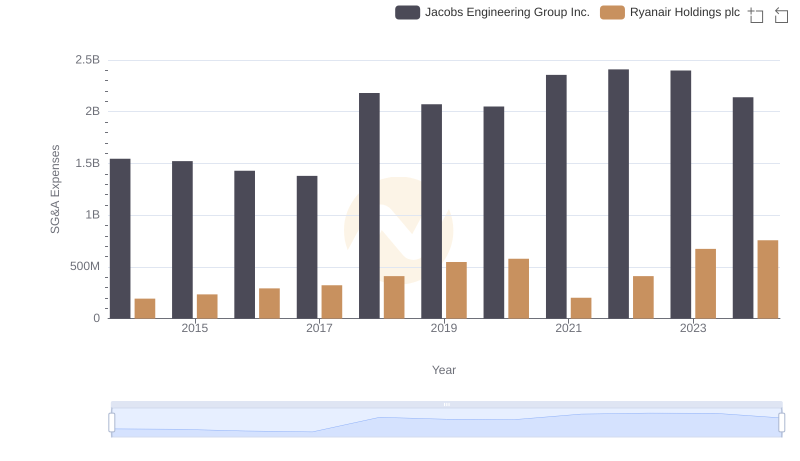
Who Optimizes SG&A Costs Better? Ryanair Holdings plc or Jacobs Engineering Group Inc.