| __timestamp | Lennox International Inc. | Ryanair Holdings plc |
|---|---|---|
| Wednesday, January 1, 2014 | 573700000 | 192800000 |
| Thursday, January 1, 2015 | 580500000 | 233900000 |
| Friday, January 1, 2016 | 621000000 | 292700000 |
| Sunday, January 1, 2017 | 637700000 | 322300000 |
| Monday, January 1, 2018 | 608200000 | 410400000 |
| Tuesday, January 1, 2019 | 585900000 | 547300000 |
| Wednesday, January 1, 2020 | 555900000 | 578800000 |
| Friday, January 1, 2021 | 598900000 | 201500000 |
| Saturday, January 1, 2022 | 627200000 | 411300000 |
| Sunday, January 1, 2023 | 705500000 | 674400000 |
| Monday, January 1, 2024 | 730600000 | 757200000 |
Infusing magic into the data realm
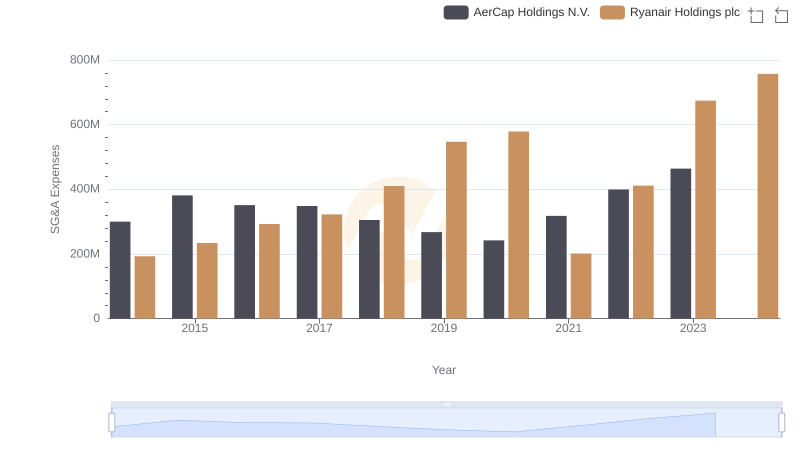
In the ever-evolving landscape of corporate finance, understanding the nuances of Selling, General, and Administrative (SG&A) expenses is crucial. Over the past decade, Lennox International Inc. and Ryanair Holdings plc have showcased intriguing trends in their SG&A expenditures. From 2014 to 2023, Lennox International Inc. maintained a steady increase, with expenses growing approximately 27% over the period. In contrast, Ryanair Holdings plc experienced a more volatile trajectory, with a notable dip in 2021, followed by a sharp recovery, culminating in a 293% increase by 2023. This divergence highlights the distinct operational strategies and market challenges faced by these industry giants. As we look to the future, these trends offer valuable insights into the financial health and strategic priorities of these companies, providing a window into their potential growth trajectories.
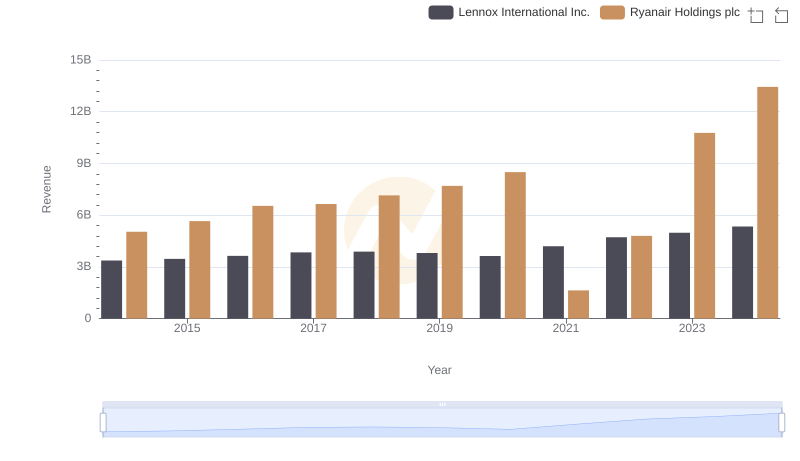
Annual Revenue Comparison: Ryanair Holdings plc vs Lennox International Inc.
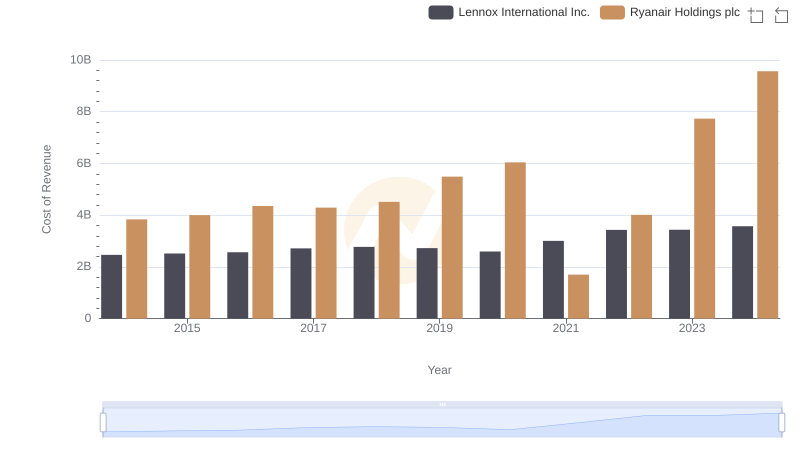
Ryanair Holdings plc vs Lennox International Inc.: Efficiency in Cost of Revenue Explored
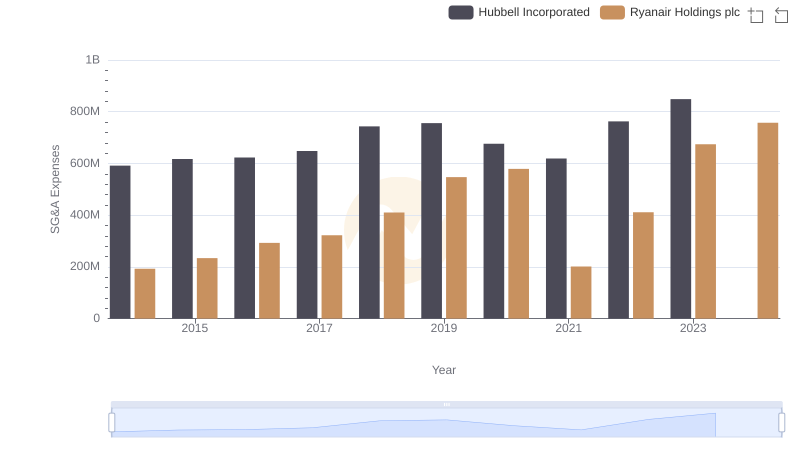
Operational Costs Compared: SG&A Analysis of Ryanair Holdings plc and Hubbell Incorporated
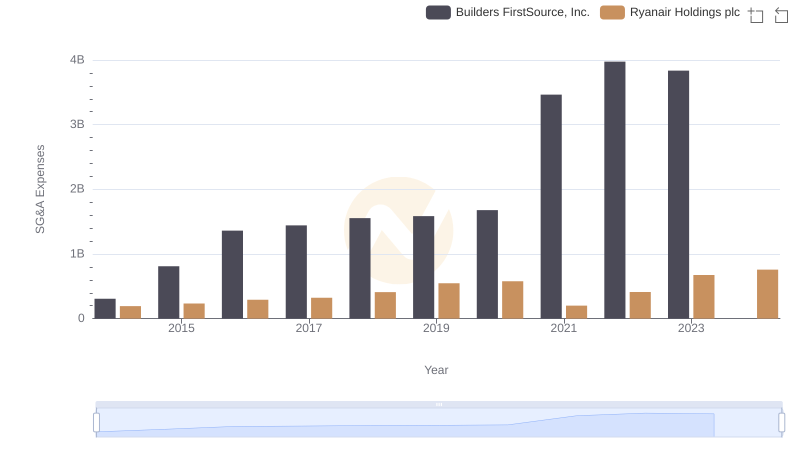
Cost Management Insights: SG&A Expenses for Ryanair Holdings plc and Builders FirstSource, Inc.

Breaking Down SG&A Expenses: Ryanair Holdings plc vs Southwest Airlines Co.
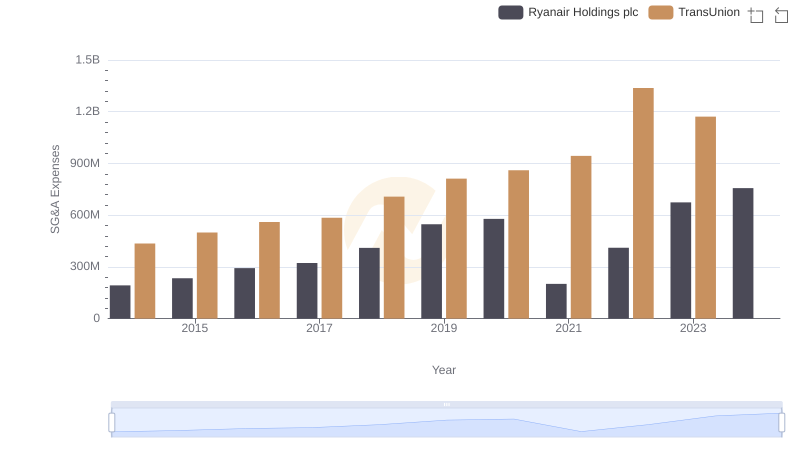
Comparing SG&A Expenses: Ryanair Holdings plc vs TransUnion Trends and Insights
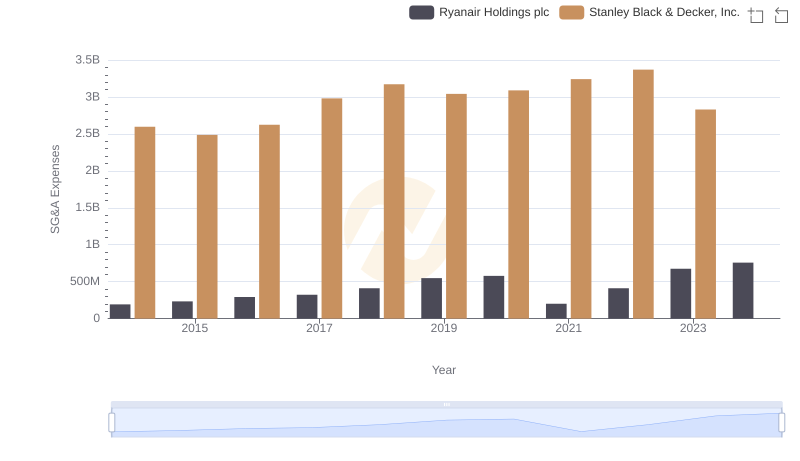
Operational Costs Compared: SG&A Analysis of Ryanair Holdings plc and Stanley Black & Decker, Inc.
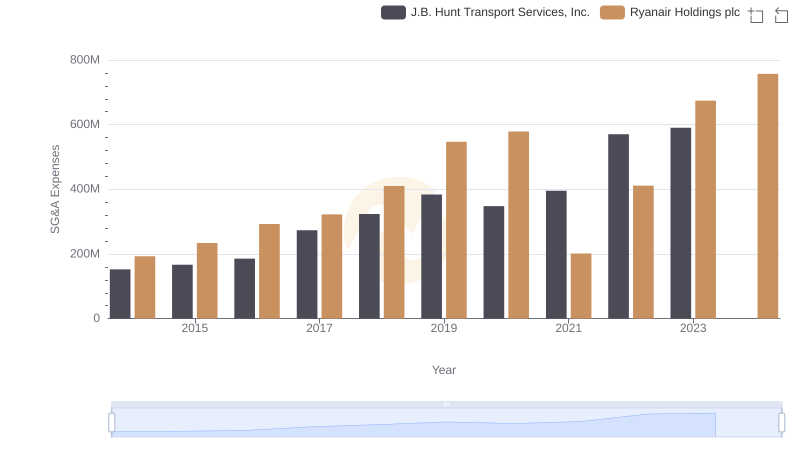
Selling, General, and Administrative Costs: Ryanair Holdings plc vs J.B. Hunt Transport Services, Inc.
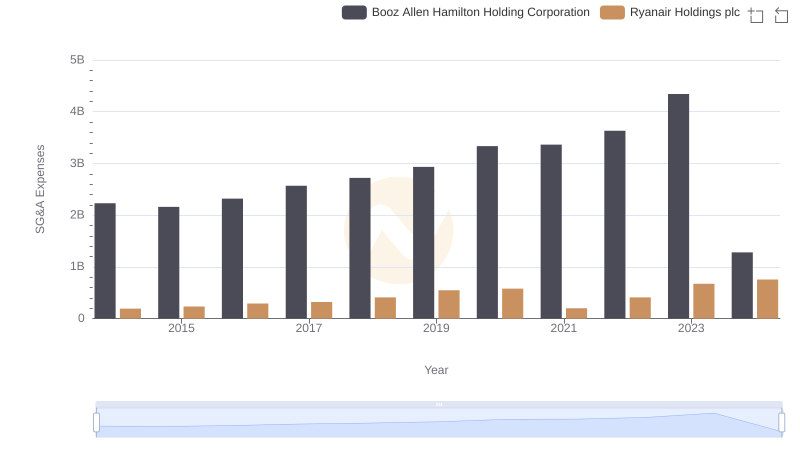
Cost Management Insights: SG&A Expenses for Ryanair Holdings plc and Booz Allen Hamilton Holding Corporation
Ryanair Holdings plc and AerCap Holdings N.V.: SG&A Spending Patterns Compared