| __timestamp | Check Point Software Technologies Ltd. | International Business Machines Corporation |
|---|---|---|
| Wednesday, January 1, 2014 | 1319275000 | 46407000000 |
| Thursday, January 1, 2015 | 1440781000 | 40684000000 |
| Friday, January 1, 2016 | 1539298000 | 38516000000 |
| Sunday, January 1, 2017 | 1641695000 | 36943000000 |
| Monday, January 1, 2018 | 1715096000 | 36936000000 |
| Tuesday, January 1, 2019 | 1779400000 | 31533000000 |
| Wednesday, January 1, 2020 | 1838400000 | 30865000000 |
| Friday, January 1, 2021 | 1908700000 | 31486000000 |
| Saturday, January 1, 2022 | 2025500000 | 32687000000 |
| Sunday, January 1, 2023 | 2132100000 | 34300000000 |
| Monday, January 1, 2024 | 35551000000 |
Igniting the spark of knowledge
In the ever-evolving landscape of technology, the financial performance of industry leaders offers a window into their strategic prowess. Over the past decade, International Business Machines Corporation (IBM) and Check Point Software Technologies Ltd. have showcased contrasting trajectories in gross profit. From 2014 to 2023, IBM's gross profit has seen a decline of approximately 26%, reflecting a shift in its business model and market challenges. In contrast, Check Point Software Technologies has experienced a robust growth of around 62% in the same period, underscoring its stronghold in cybersecurity solutions.
While IBM's gross profit peaked in 2014, Check Point's consistent upward trend highlights its resilience and adaptability. The data for 2024 remains incomplete, leaving room for speculation on future trends. As these two titans continue to navigate the digital frontier, their financial narratives offer valuable insights into the broader tech industry dynamics.
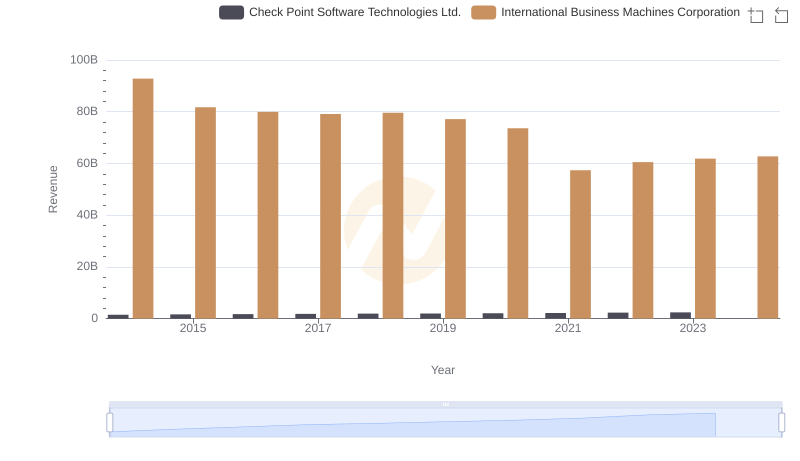
Annual Revenue Comparison: International Business Machines Corporation vs Check Point Software Technologies Ltd.
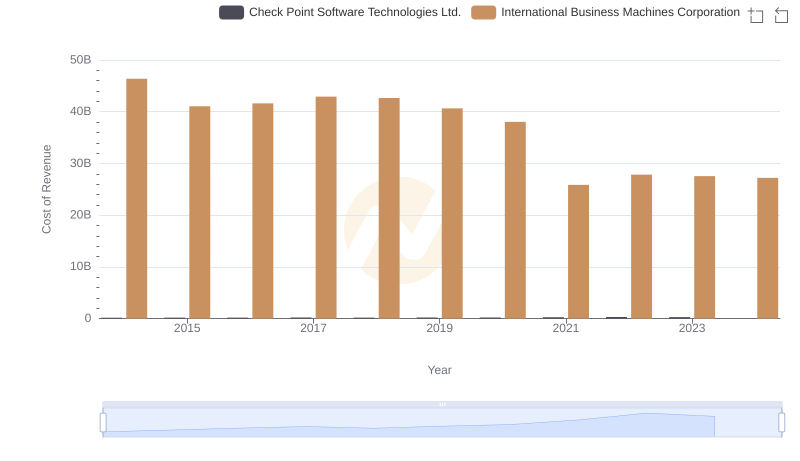
Cost of Revenue: Key Insights for International Business Machines Corporation and Check Point Software Technologies Ltd.
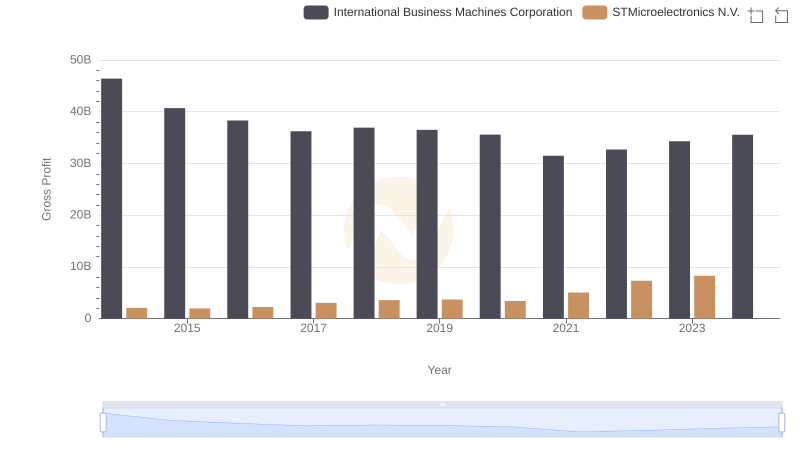
Who Generates Higher Gross Profit? International Business Machines Corporation or STMicroelectronics N.V.
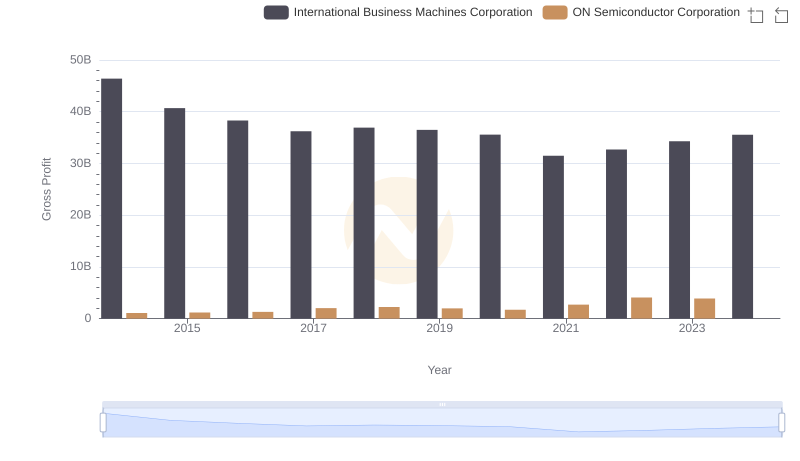
International Business Machines Corporation vs ON Semiconductor Corporation: A Gross Profit Performance Breakdown
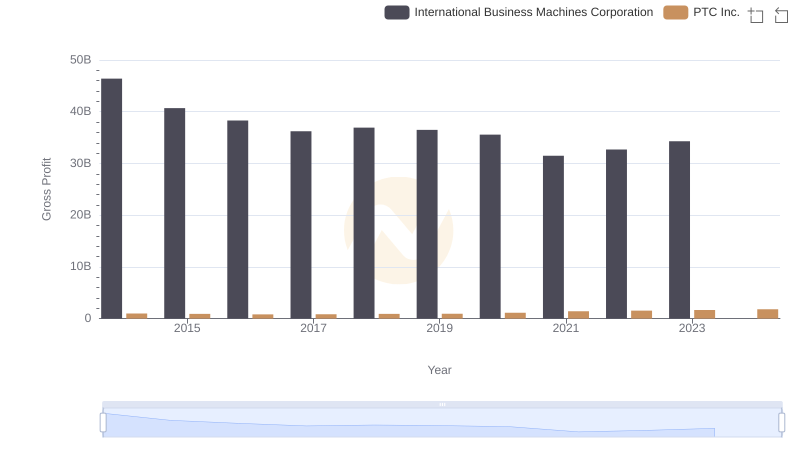
Gross Profit Analysis: Comparing International Business Machines Corporation and PTC Inc.
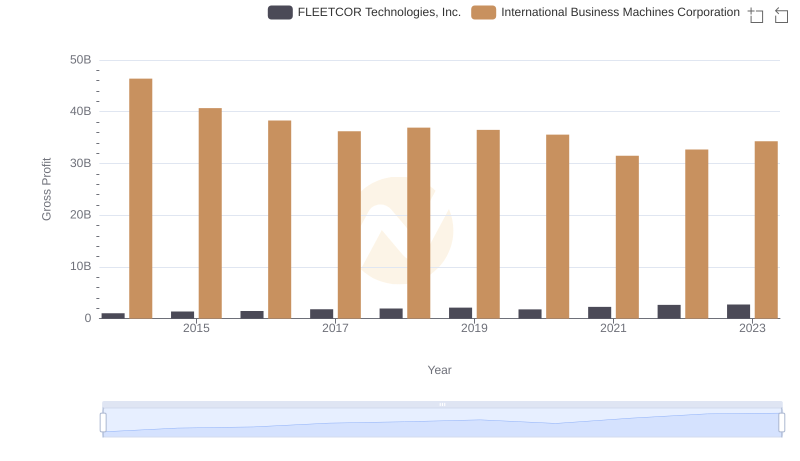
Gross Profit Comparison: International Business Machines Corporation and FLEETCOR Technologies, Inc. Trends
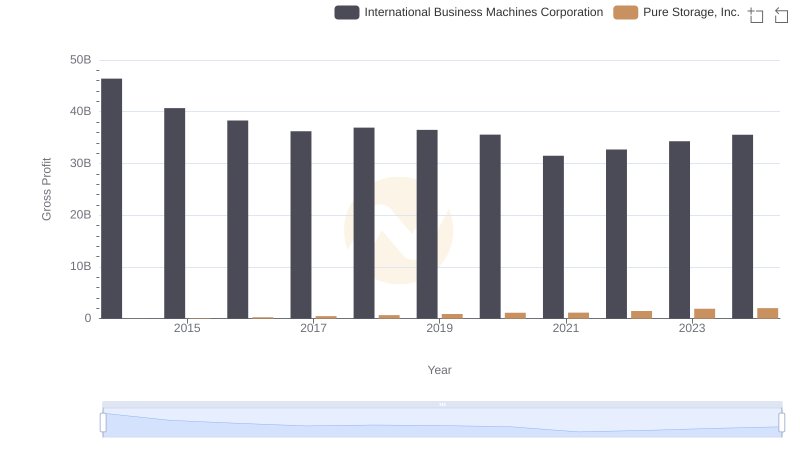
Gross Profit Trends Compared: International Business Machines Corporation vs Pure Storage, Inc.
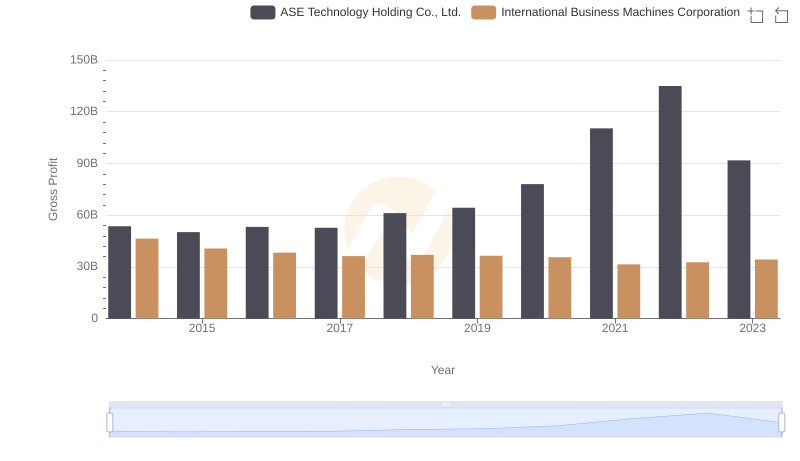
International Business Machines Corporation vs ASE Technology Holding Co., Ltd.: A Gross Profit Performance Breakdown
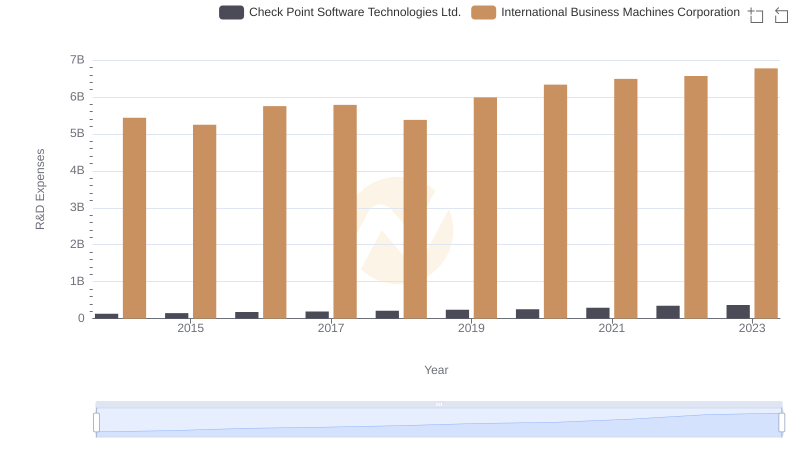
Research and Development Investment: International Business Machines Corporation vs Check Point Software Technologies Ltd.
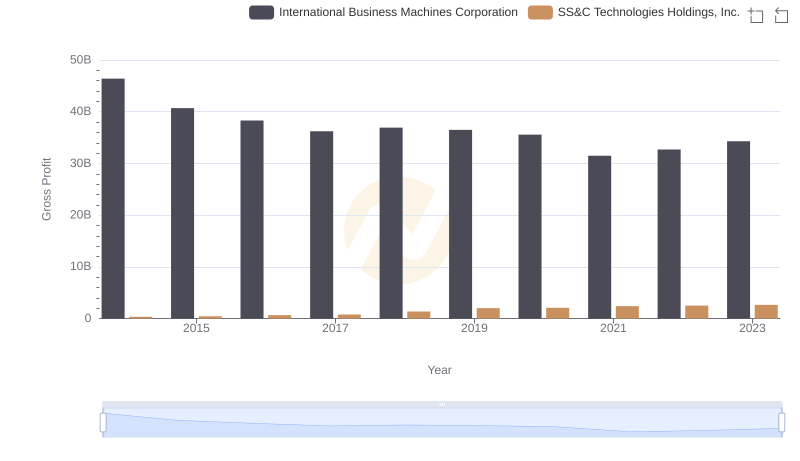
Who Generates Higher Gross Profit? International Business Machines Corporation or SS&C Technologies Holdings, Inc.
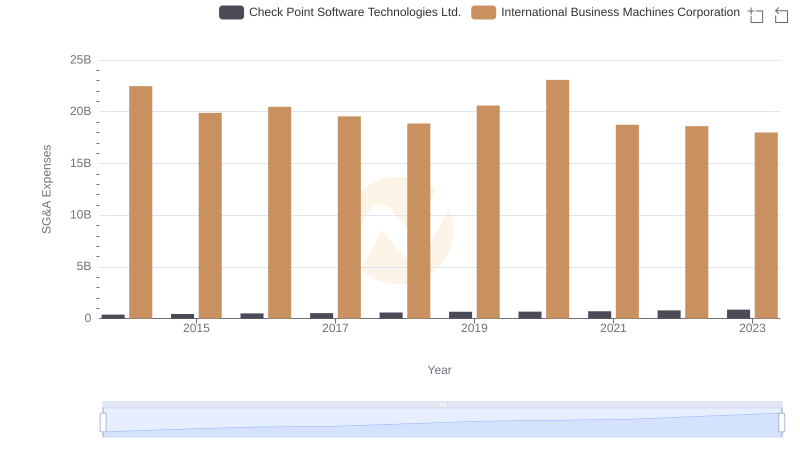
Operational Costs Compared: SG&A Analysis of International Business Machines Corporation and Check Point Software Technologies Ltd.
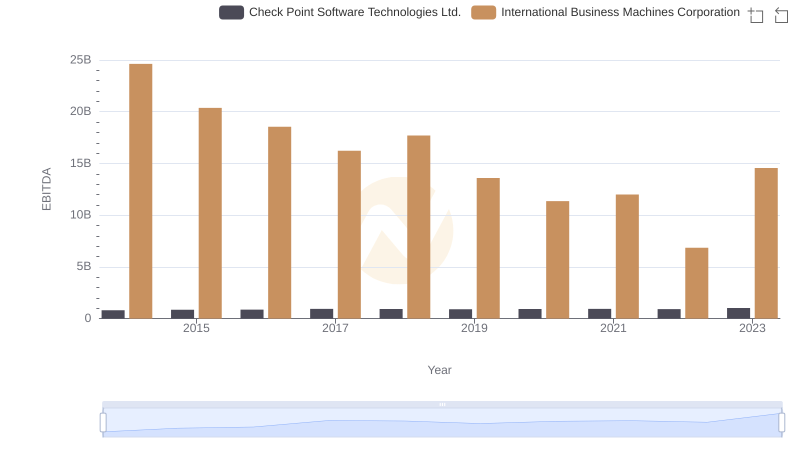
International Business Machines Corporation and Check Point Software Technologies Ltd.: A Detailed Examination of EBITDA Performance