| __timestamp | Cisco Systems, Inc. | STMicroelectronics N.V. |
|---|---|---|
| Wednesday, January 1, 2014 | 27769000000 | 2083000000 |
| Thursday, January 1, 2015 | 29681000000 | 1990000000 |
| Friday, January 1, 2016 | 30960000000 | 2242000000 |
| Sunday, January 1, 2017 | 30224000000 | 3034000000 |
| Monday, January 1, 2018 | 30606000000 | 3568000000 |
| Tuesday, January 1, 2019 | 32666000000 | 3696000000 |
| Wednesday, January 1, 2020 | 31683000000 | 3400000000 |
| Friday, January 1, 2021 | 31894000000 | 5053000000 |
| Saturday, January 1, 2022 | 32248000000 | 7331000000 |
| Sunday, January 1, 2023 | 35753000000 | 8287000000 |
| Monday, January 1, 2024 | 34828000000 |
Unleashing the power of data
In the ever-evolving tech industry, understanding financial health is crucial. Cisco Systems, Inc. and STMicroelectronics N.V. have shown intriguing trends in their gross profits over the past decade. From 2014 to 2023, Cisco's gross profit has consistently grown, peaking in 2023 with a 29% increase from 2014. This steady rise reflects Cisco's robust market strategies and innovation.
Conversely, STMicroelectronics has demonstrated a remarkable growth trajectory, with its gross profit surging by nearly 300% from 2014 to 2023. This impressive leap underscores STMicroelectronics' expanding influence in the semiconductor industry.
While Cisco's data for 2024 is available, STMicroelectronics' figures remain undisclosed, leaving room for speculation. This analysis highlights the dynamic nature of the tech sector, where strategic decisions and market demands shape financial outcomes.
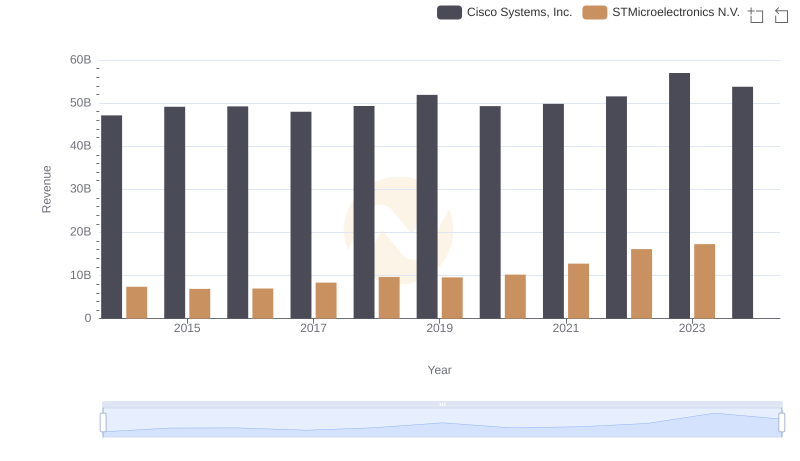
Cisco Systems, Inc. vs STMicroelectronics N.V.: Annual Revenue Growth Compared
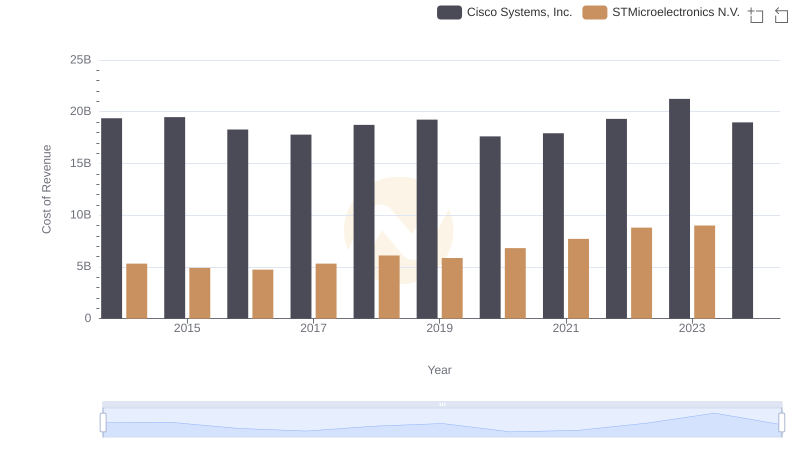
Cisco Systems, Inc. vs STMicroelectronics N.V.: Efficiency in Cost of Revenue Explored
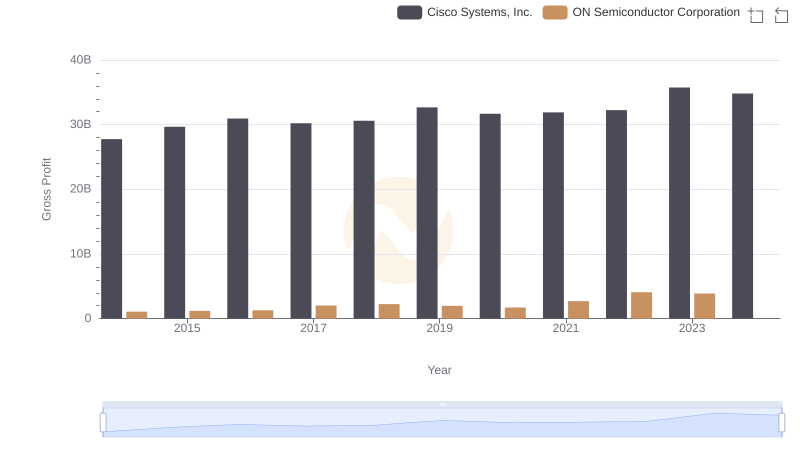
Gross Profit Analysis: Comparing Cisco Systems, Inc. and ON Semiconductor Corporation
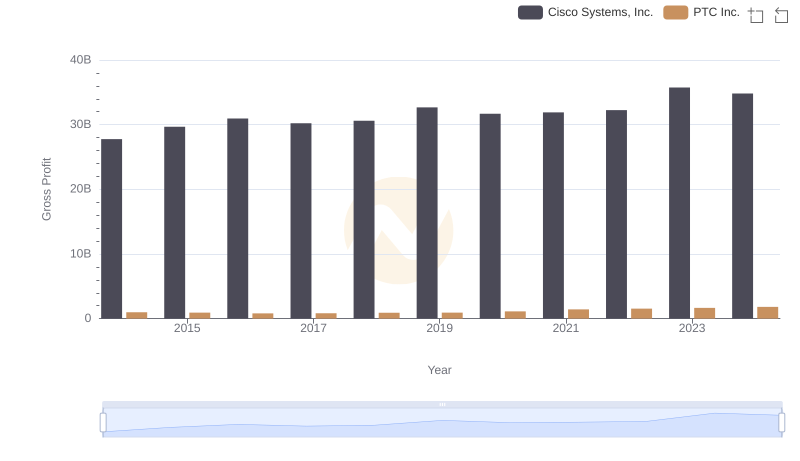
Who Generates Higher Gross Profit? Cisco Systems, Inc. or PTC Inc.
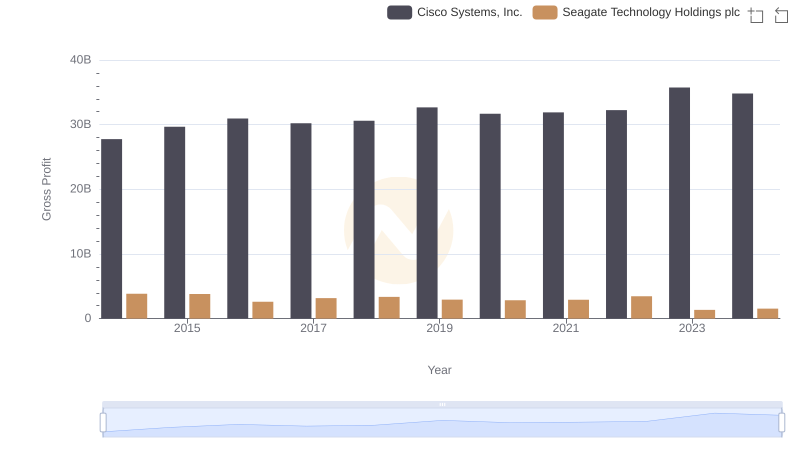
Who Generates Higher Gross Profit? Cisco Systems, Inc. or Seagate Technology Holdings plc
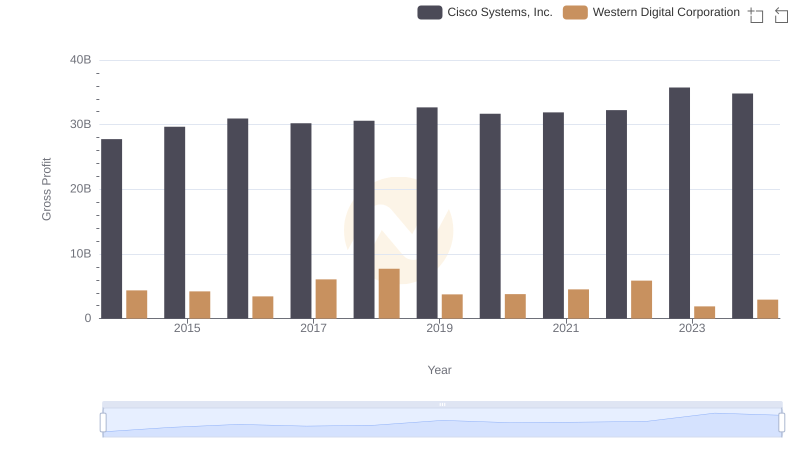
Cisco Systems, Inc. and Western Digital Corporation: A Detailed Gross Profit Analysis
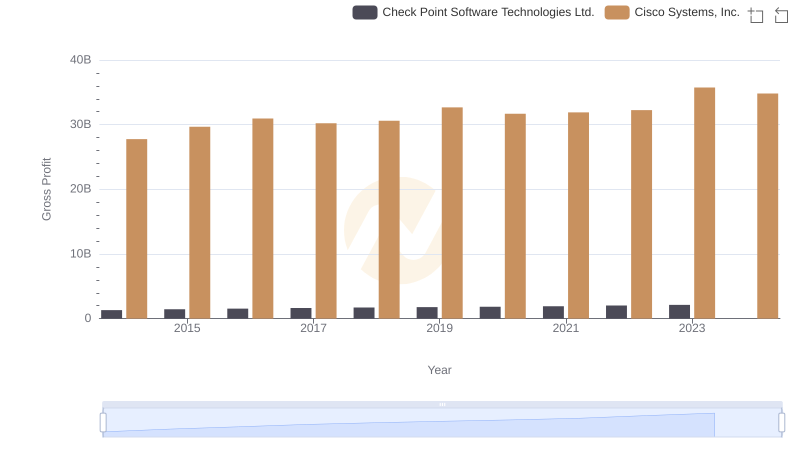
Key Insights on Gross Profit: Cisco Systems, Inc. vs Check Point Software Technologies Ltd.
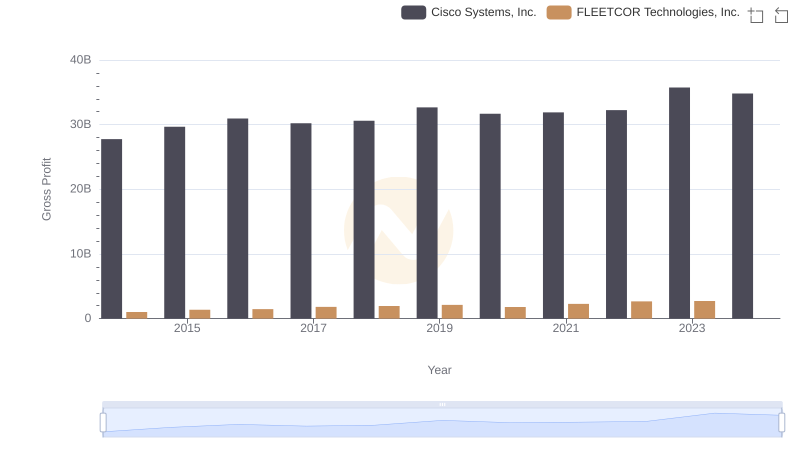
Gross Profit Analysis: Comparing Cisco Systems, Inc. and FLEETCOR Technologies, Inc.
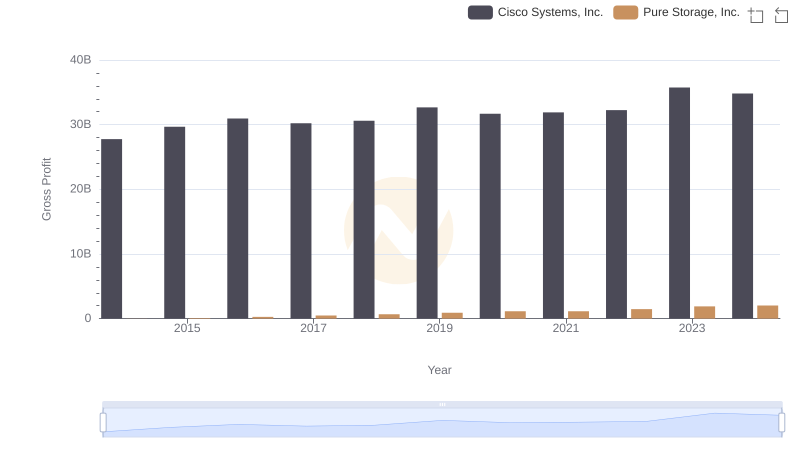
Gross Profit Comparison: Cisco Systems, Inc. and Pure Storage, Inc. Trends
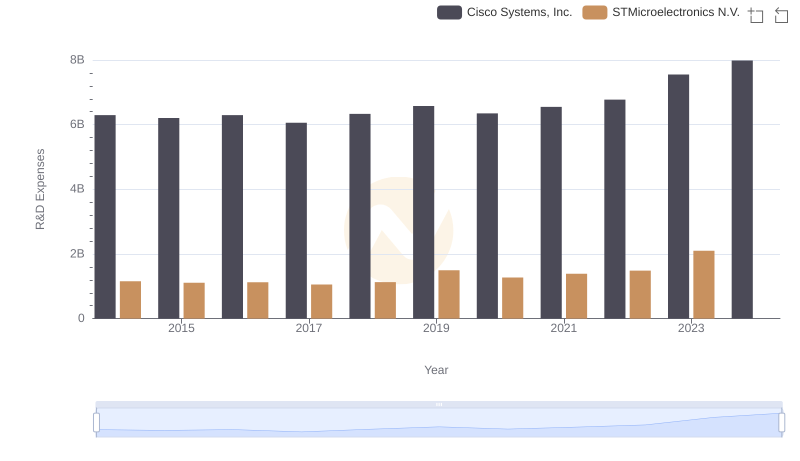
Analyzing R&D Budgets: Cisco Systems, Inc. vs STMicroelectronics N.V.
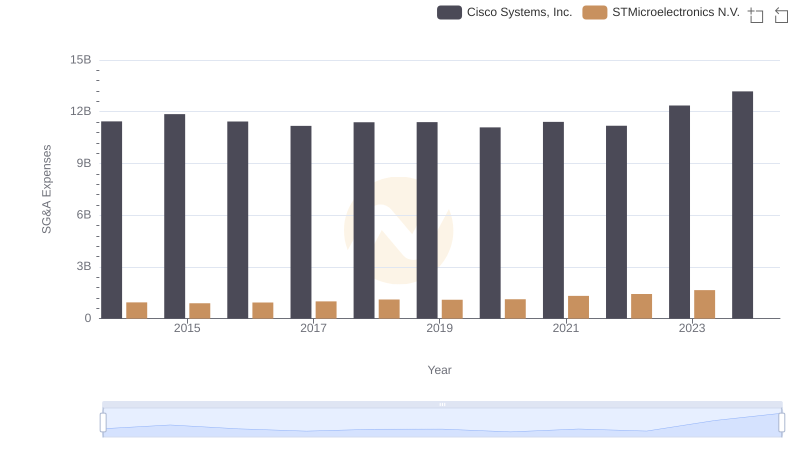
Operational Costs Compared: SG&A Analysis of Cisco Systems, Inc. and STMicroelectronics N.V.
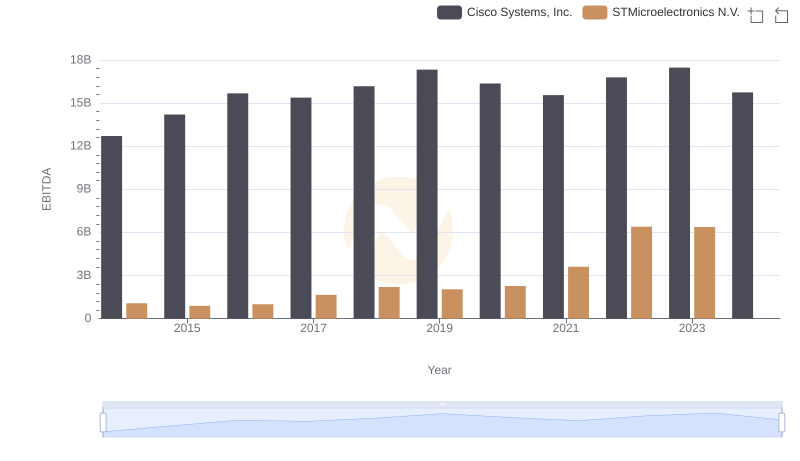
EBITDA Analysis: Evaluating Cisco Systems, Inc. Against STMicroelectronics N.V.