| __timestamp | Old Dominion Freight Line, Inc. | XPO Logistics, Inc. |
|---|---|---|
| Wednesday, January 1, 2014 | 2100409000 | 1975000000 |
| Thursday, January 1, 2015 | 2214943000 | 6538400000 |
| Friday, January 1, 2016 | 2246890000 | 12480100000 |
| Sunday, January 1, 2017 | 2482732000 | 13101100000 |
| Monday, January 1, 2018 | 2899452000 | 14738000000 |
| Tuesday, January 1, 2019 | 2938895000 | 13982000000 |
| Wednesday, January 1, 2020 | 2786531000 | 13689000000 |
| Friday, January 1, 2021 | 3481268000 | 10812000000 |
| Saturday, January 1, 2022 | 4003951000 | 6491000000 |
| Sunday, January 1, 2023 | 3793953000 | 6974000000 |
| Monday, January 1, 2024 | 7157000000 |
Unveiling the hidden dimensions of data
In the competitive landscape of freight and logistics, understanding cost dynamics is crucial. From 2014 to 2023, Old Dominion Freight Line, Inc. and XPO Logistics, Inc. have shown distinct trends in their cost of revenue. Old Dominion's cost of revenue increased by approximately 80% over this period, peaking in 2022. This reflects their strategic investments in infrastructure and technology to enhance service efficiency. Meanwhile, XPO Logistics experienced a more volatile trajectory, with a significant rise until 2018, followed by a decline, indicating a shift in operational strategies or market conditions. By 2023, XPO's cost of revenue was about 3.5 times that of Old Dominion, highlighting their larger scale of operations. These insights provide a window into the financial strategies of two major players in the logistics industry, offering valuable lessons for stakeholders and investors.
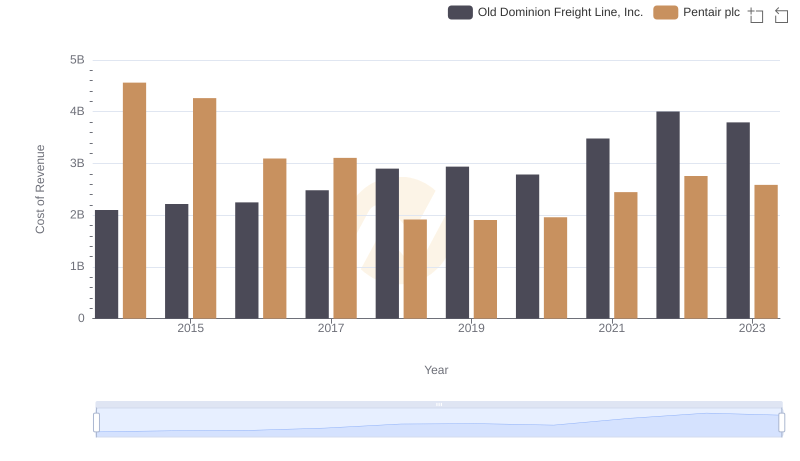
Old Dominion Freight Line, Inc. vs Pentair plc: Efficiency in Cost of Revenue Explored
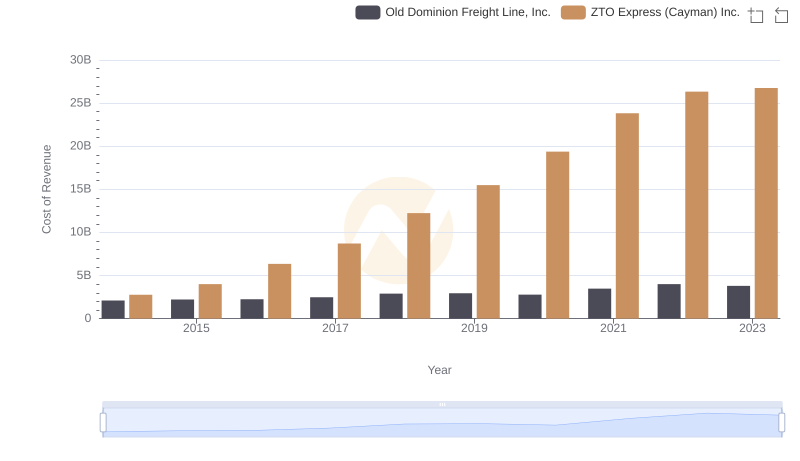
Old Dominion Freight Line, Inc. vs ZTO Express (Cayman) Inc.: Efficiency in Cost of Revenue Explored
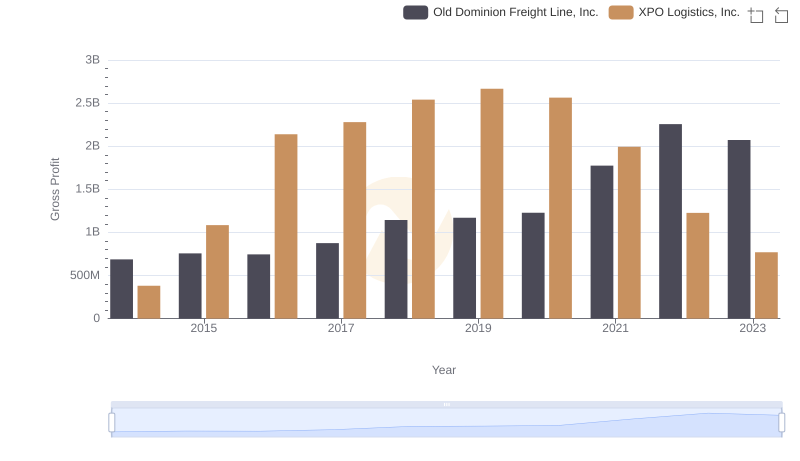
Key Insights on Gross Profit: Old Dominion Freight Line, Inc. vs XPO Logistics, Inc.
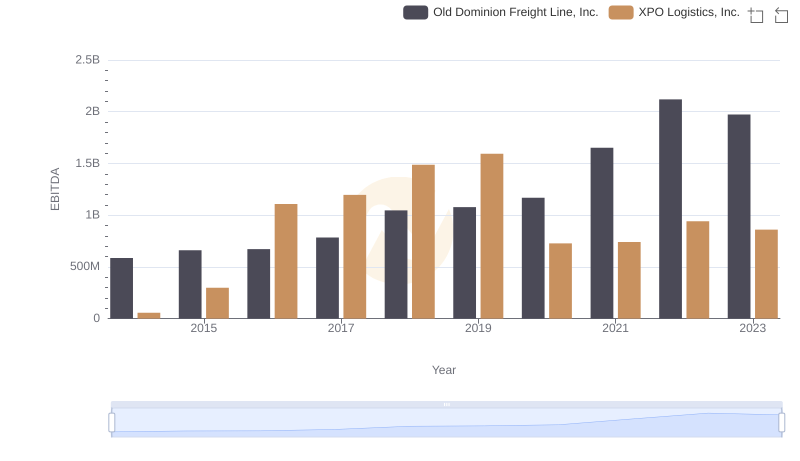
Old Dominion Freight Line, Inc. and XPO Logistics, Inc.: A Detailed Examination of EBITDA Performance