| __timestamp | Old Dominion Freight Line, Inc. | XPO Logistics, Inc. |
|---|---|---|
| Wednesday, January 1, 2014 | 687488000 | 381600000 |
| Thursday, January 1, 2015 | 757499000 | 1084800000 |
| Friday, January 1, 2016 | 744627000 | 2139300000 |
| Sunday, January 1, 2017 | 875380000 | 2279700000 |
| Monday, January 1, 2018 | 1144243000 | 2541000000 |
| Tuesday, January 1, 2019 | 1170216000 | 2666000000 |
| Wednesday, January 1, 2020 | 1228598000 | 2563000000 |
| Friday, January 1, 2021 | 1775060000 | 1994000000 |
| Saturday, January 1, 2022 | 2256126000 | 1227000000 |
| Sunday, January 1, 2023 | 2072199000 | 770000000 |
| Monday, January 1, 2024 | 915000000 |
Infusing magic into the data realm
In the competitive landscape of freight and logistics, understanding financial performance is crucial. Over the past decade, Old Dominion Freight Line, Inc. and XPO Logistics, Inc. have showcased distinct trajectories in gross profit. From 2014 to 2023, Old Dominion's gross profit surged by approximately 200%, peaking in 2022. In contrast, XPO Logistics experienced a more volatile journey, with a notable decline of around 70% from its 2019 peak to 2023.
Old Dominion's consistent growth reflects its strategic market positioning and operational efficiency, while XPO's fluctuations highlight the challenges in adapting to market dynamics. The year 2022 marked a pivotal point where Old Dominion surpassed XPO, emphasizing its resilience and adaptability. As the logistics industry evolves, these insights offer a glimpse into the financial health and strategic direction of two major players.
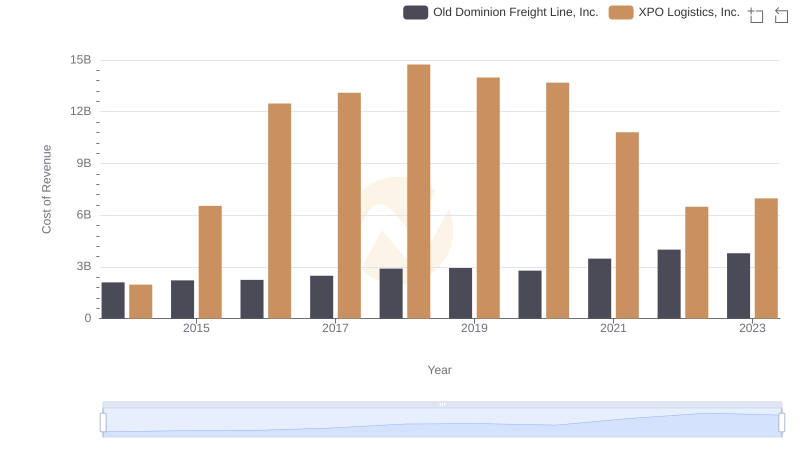
Cost of Revenue: Key Insights for Old Dominion Freight Line, Inc. and XPO Logistics, Inc.
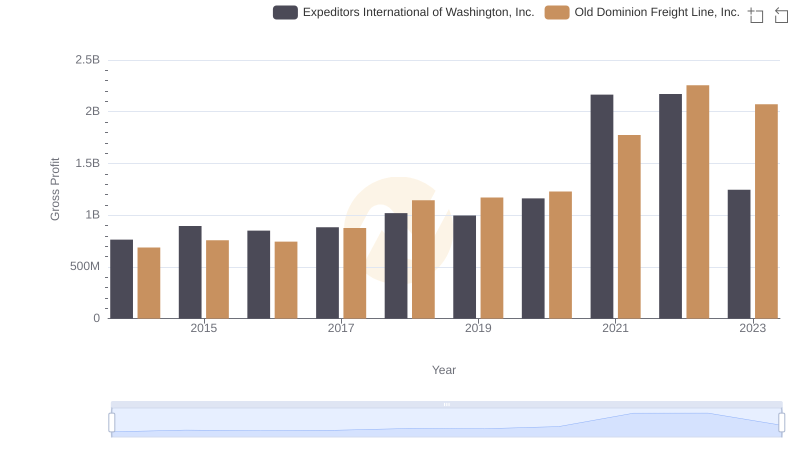
Gross Profit Analysis: Comparing Old Dominion Freight Line, Inc. and Expeditors International of Washington, Inc.
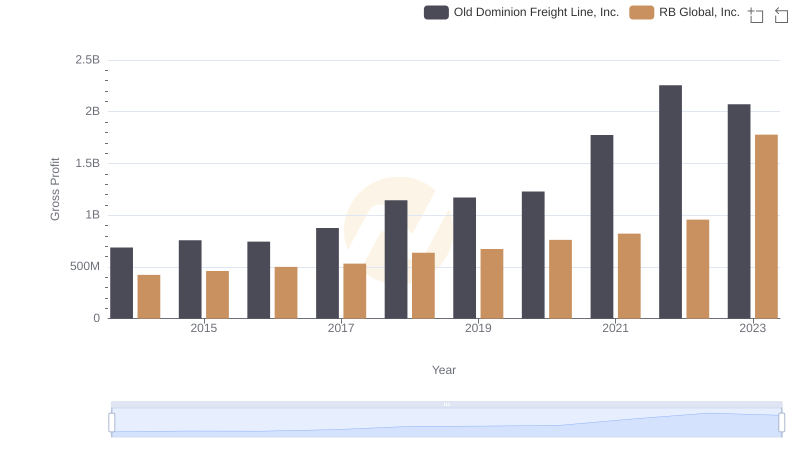
Key Insights on Gross Profit: Old Dominion Freight Line, Inc. vs RB Global, Inc.
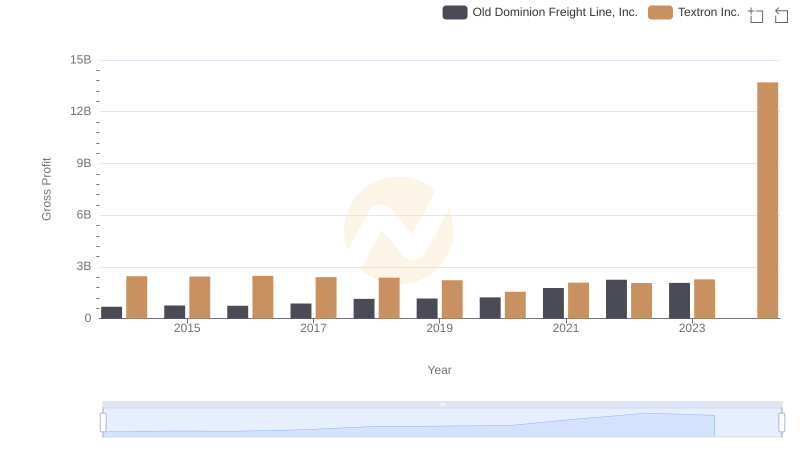
Old Dominion Freight Line, Inc. vs Textron Inc.: A Gross Profit Performance Breakdown
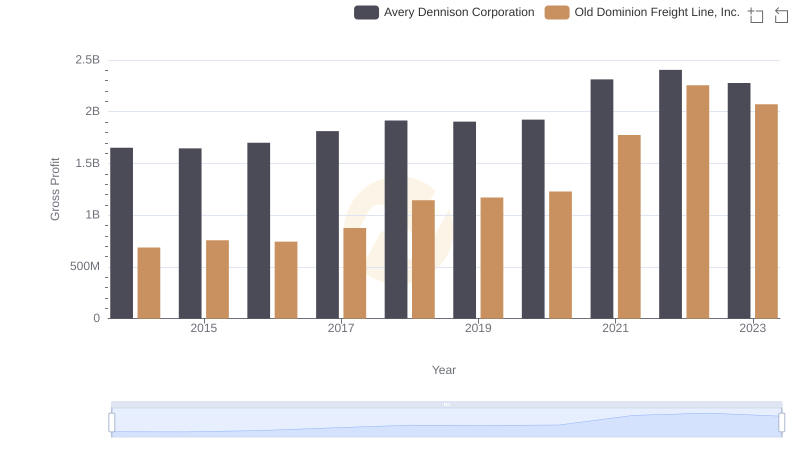
Gross Profit Analysis: Comparing Old Dominion Freight Line, Inc. and Avery Dennison Corporation
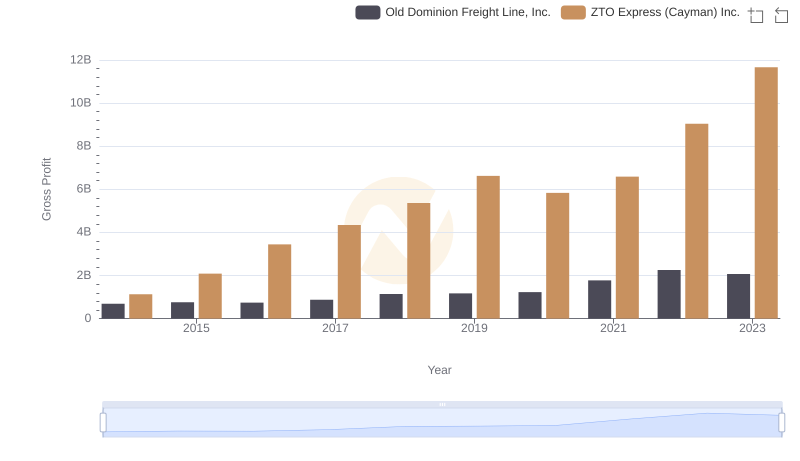
Gross Profit Comparison: Old Dominion Freight Line, Inc. and ZTO Express (Cayman) Inc. Trends
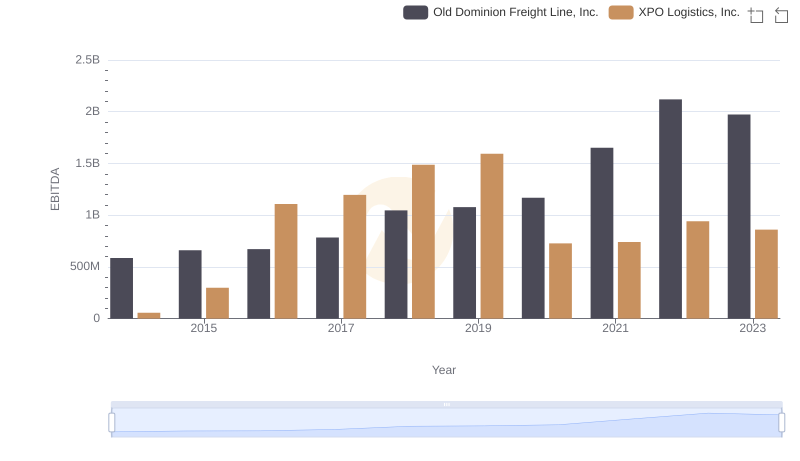
Old Dominion Freight Line, Inc. and XPO Logistics, Inc.: A Detailed Examination of EBITDA Performance