| __timestamp | Jacobs Engineering Group Inc. | Westinghouse Air Brake Technologies Corporation |
|---|---|---|
| Wednesday, January 1, 2014 | 2073784000 | 913534000 |
| Thursday, January 1, 2015 | 1968338000 | 1026153000 |
| Friday, January 1, 2016 | 1767831000 | 901541000 |
| Sunday, January 1, 2017 | 1772252000 | 1040597000 |
| Monday, January 1, 2018 | 2828370000 | 1211731000 |
| Tuesday, January 1, 2019 | 2477028000 | 2077600000 |
| Wednesday, January 1, 2020 | 2586668000 | 1898700000 |
| Friday, January 1, 2021 | 3043772000 | 2135000000 |
| Saturday, January 1, 2022 | 3327040000 | 2292000000 |
| Sunday, January 1, 2023 | 3473315000 | 2944000000 |
| Monday, January 1, 2024 | 2832756000 | 3366000000 |
Unleashing the power of data
In the competitive landscape of industrial engineering, Westinghouse Air Brake Technologies Corporation and Jacobs Engineering Group Inc. have showcased intriguing financial trajectories over the past decade. From 2014 to 2023, Jacobs Engineering consistently outperformed its counterpart, with gross profits peaking at approximately $3.5 billion in 2023, marking a 67% increase from 2014. Meanwhile, Westinghouse Air Brake Technologies saw a remarkable 222% growth, reaching nearly $2.9 billion in 2023. This growth trajectory highlights the dynamic shifts in the industry, with both companies adapting to market demands and technological advancements. Notably, the data for 2024 is incomplete, leaving room for speculation on future trends. As these industry titans continue to evolve, stakeholders and investors keenly observe their financial health, making these insights invaluable for strategic decision-making.
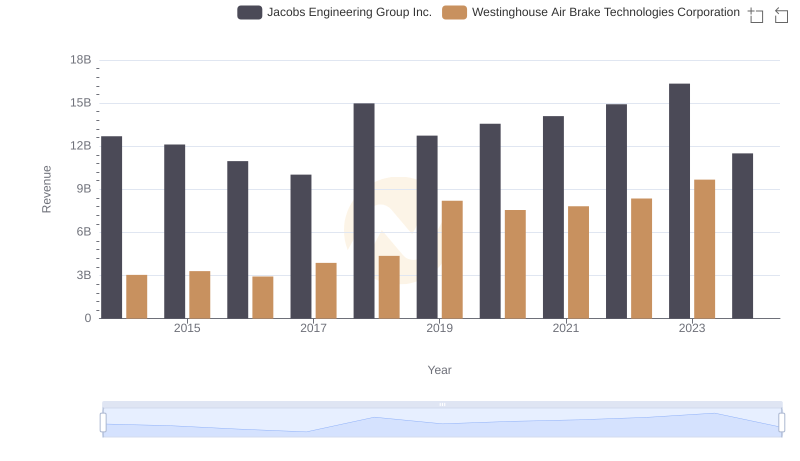
Who Generates More Revenue? Westinghouse Air Brake Technologies Corporation or Jacobs Engineering Group Inc.
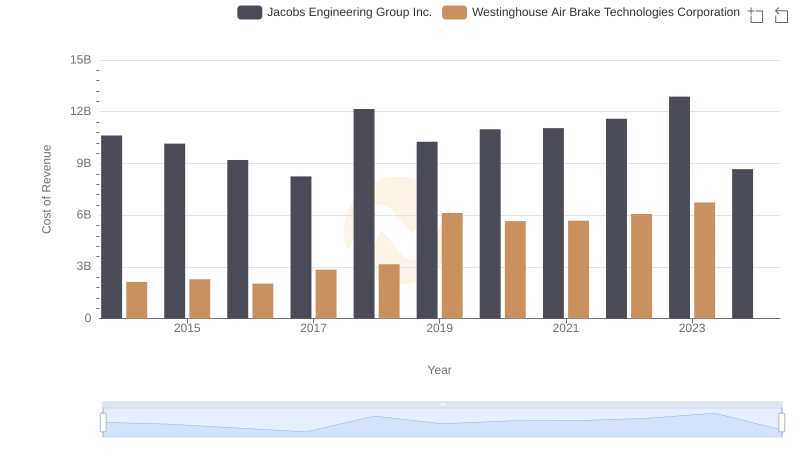
Cost Insights: Breaking Down Westinghouse Air Brake Technologies Corporation and Jacobs Engineering Group Inc.'s Expenses
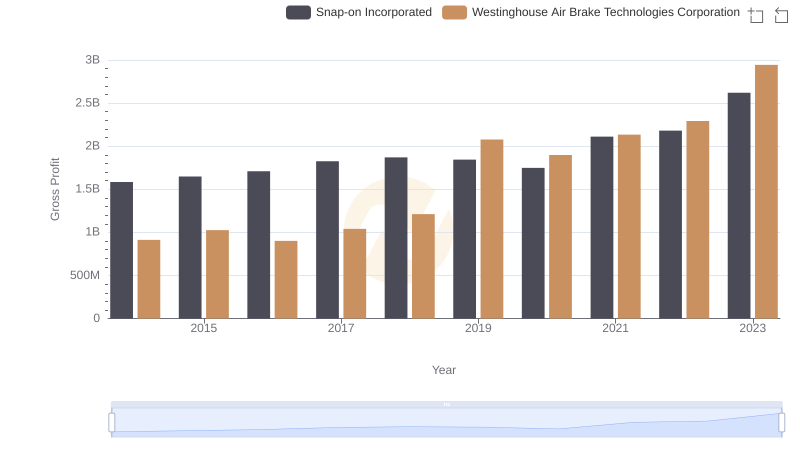
Gross Profit Analysis: Comparing Westinghouse Air Brake Technologies Corporation and Snap-on Incorporated
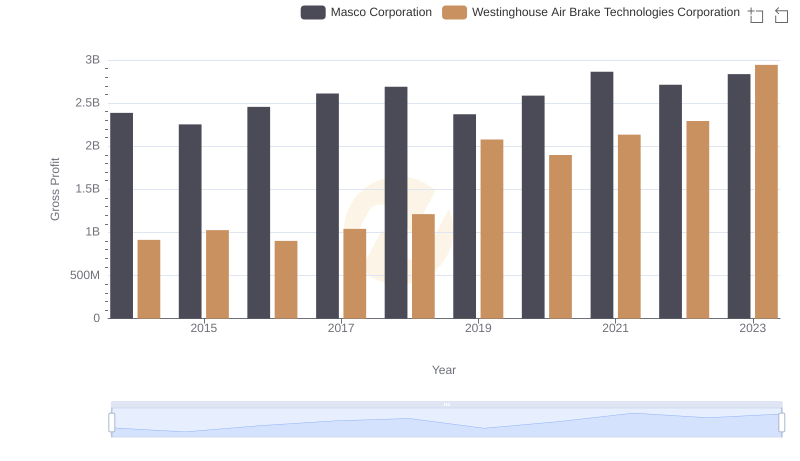
Who Generates Higher Gross Profit? Westinghouse Air Brake Technologies Corporation or Masco Corporation
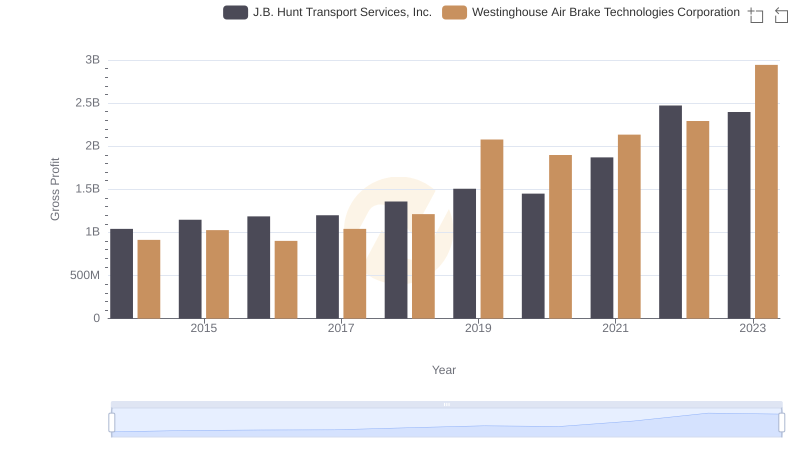
Westinghouse Air Brake Technologies Corporation vs J.B. Hunt Transport Services, Inc.: A Gross Profit Performance Breakdown
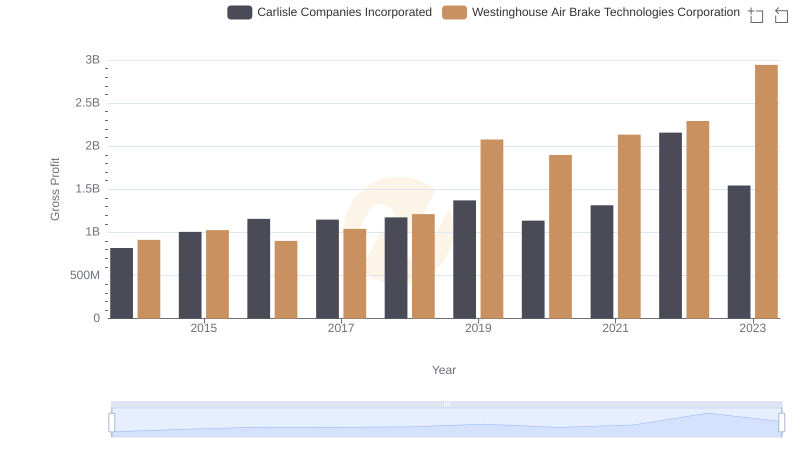
Westinghouse Air Brake Technologies Corporation and Carlisle Companies Incorporated: A Detailed Gross Profit Analysis
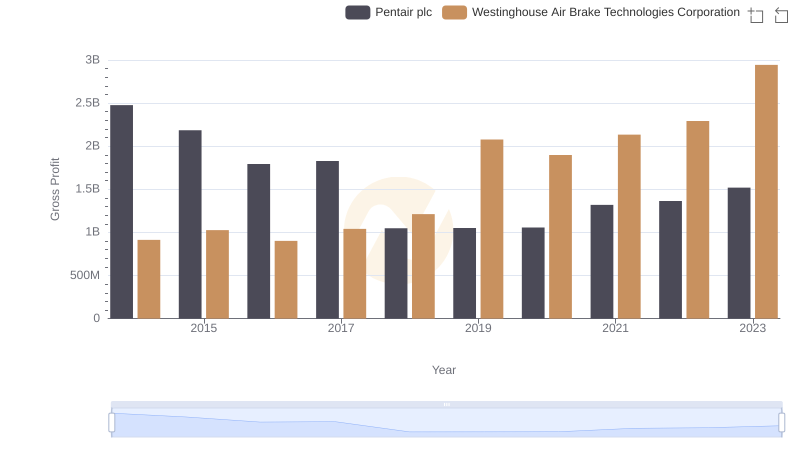
Gross Profit Comparison: Westinghouse Air Brake Technologies Corporation and Pentair plc Trends
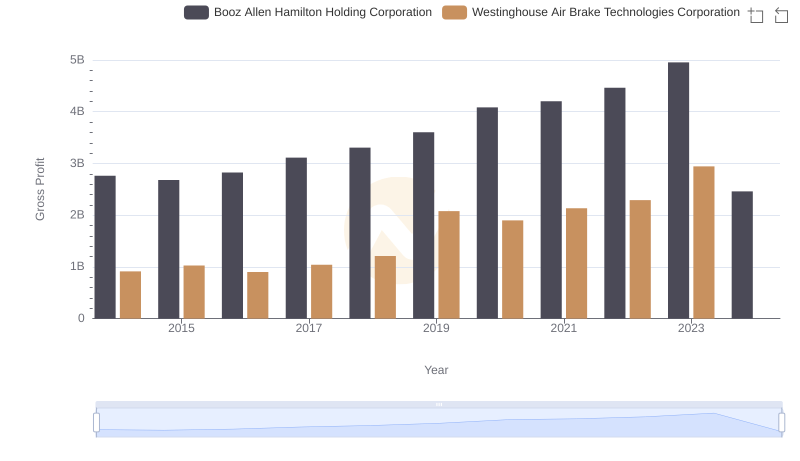
Gross Profit Comparison: Westinghouse Air Brake Technologies Corporation and Booz Allen Hamilton Holding Corporation Trends
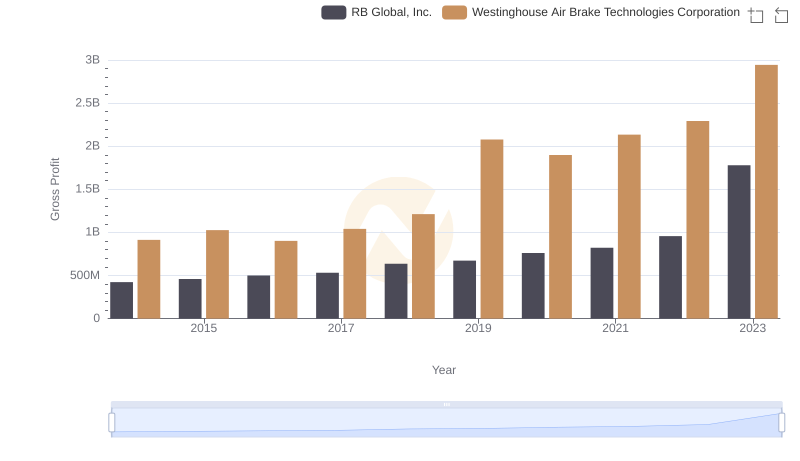
Gross Profit Comparison: Westinghouse Air Brake Technologies Corporation and RB Global, Inc. Trends
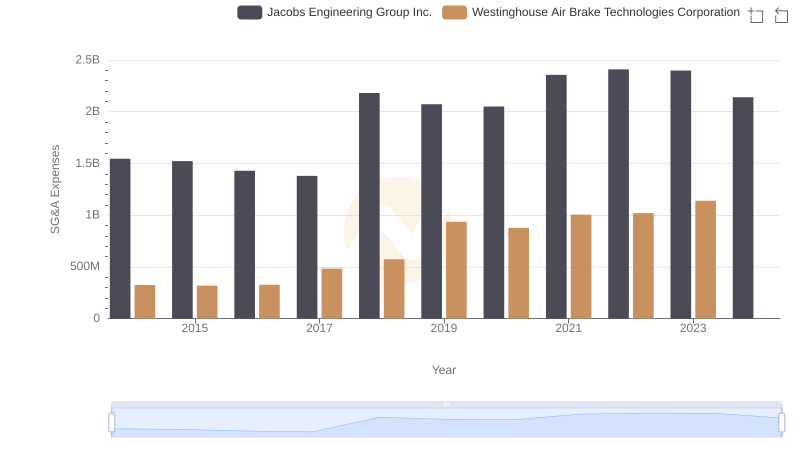
Comparing SG&A Expenses: Westinghouse Air Brake Technologies Corporation vs Jacobs Engineering Group Inc. Trends and Insights
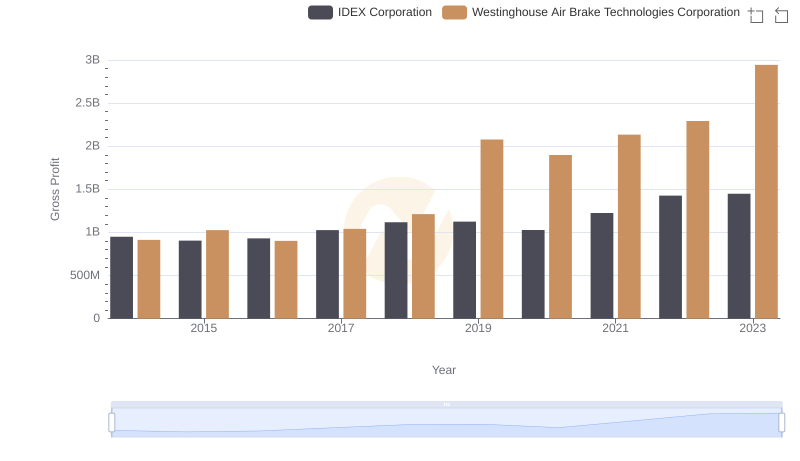
Key Insights on Gross Profit: Westinghouse Air Brake Technologies Corporation vs IDEX Corporation
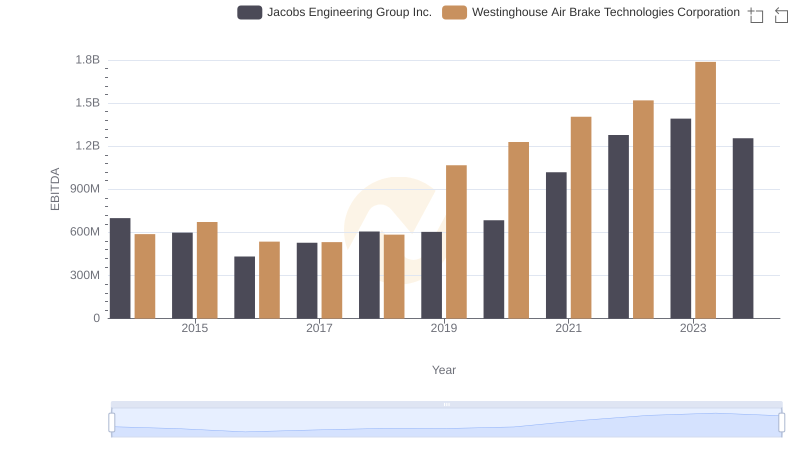
EBITDA Performance Review: Westinghouse Air Brake Technologies Corporation vs Jacobs Engineering Group Inc.