| __timestamp | Booz Allen Hamilton Holding Corporation | Westinghouse Air Brake Technologies Corporation |
|---|---|---|
| Wednesday, January 1, 2014 | 2762580000 | 913534000 |
| Thursday, January 1, 2015 | 2680921000 | 1026153000 |
| Friday, January 1, 2016 | 2825712000 | 901541000 |
| Sunday, January 1, 2017 | 3112302000 | 1040597000 |
| Monday, January 1, 2018 | 3304750000 | 1211731000 |
| Tuesday, January 1, 2019 | 3603571000 | 2077600000 |
| Wednesday, January 1, 2020 | 4084661000 | 1898700000 |
| Friday, January 1, 2021 | 4201408000 | 2135000000 |
| Saturday, January 1, 2022 | 4464078000 | 2292000000 |
| Sunday, January 1, 2023 | 4954101000 | 2944000000 |
| Monday, January 1, 2024 | 2459049000 | 3366000000 |
In pursuit of knowledge
In the ever-evolving landscape of the U.S. stock market, two industry titans, Booz Allen Hamilton Holding Corporation and Westinghouse Air Brake Technologies Corporation, have showcased intriguing trends in their gross profits over the past decade. From 2014 to 2023, Booz Allen Hamilton has seen a robust growth trajectory, with gross profits surging by approximately 80%, peaking in 2023. This growth underscores their strategic prowess in the consulting sector. Meanwhile, Westinghouse Air Brake Technologies, a key player in the transportation industry, experienced a significant 220% increase in gross profits from 2014 to 2023, reflecting their resilience and adaptability in a competitive market. However, data for 2024 remains incomplete, leaving room for speculation on future trends. These insights offer a glimpse into the financial health and strategic direction of these corporations, providing valuable information for investors and market analysts alike.
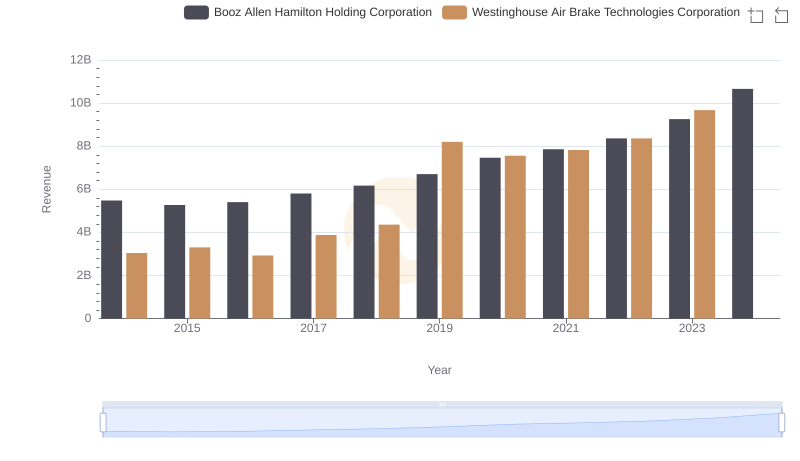
Westinghouse Air Brake Technologies Corporation vs Booz Allen Hamilton Holding Corporation: Annual Revenue Growth Compared
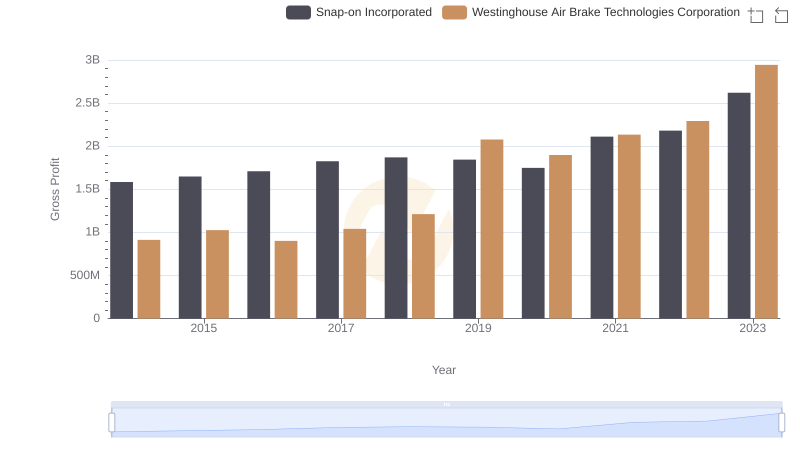
Gross Profit Analysis: Comparing Westinghouse Air Brake Technologies Corporation and Snap-on Incorporated
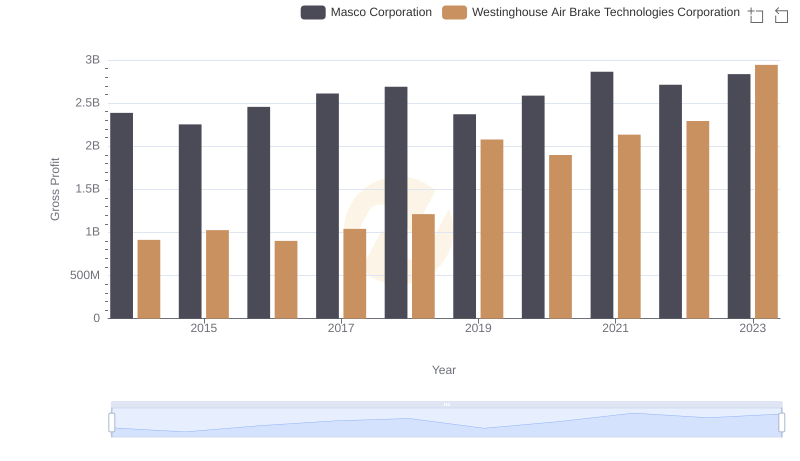
Who Generates Higher Gross Profit? Westinghouse Air Brake Technologies Corporation or Masco Corporation
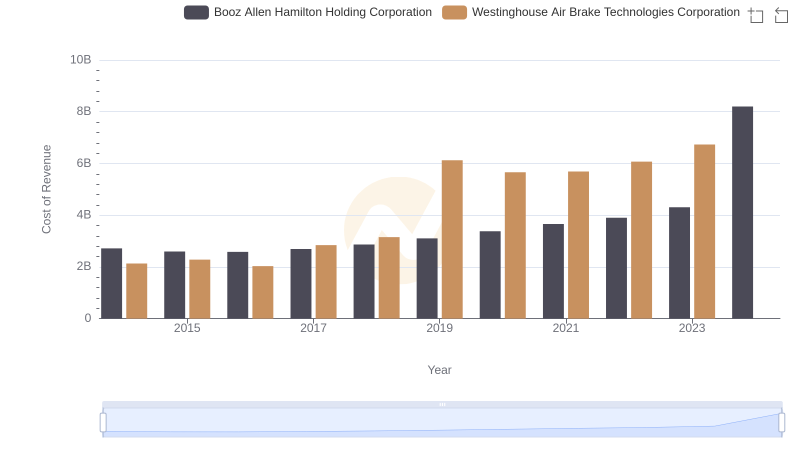
Westinghouse Air Brake Technologies Corporation vs Booz Allen Hamilton Holding Corporation: Efficiency in Cost of Revenue Explored
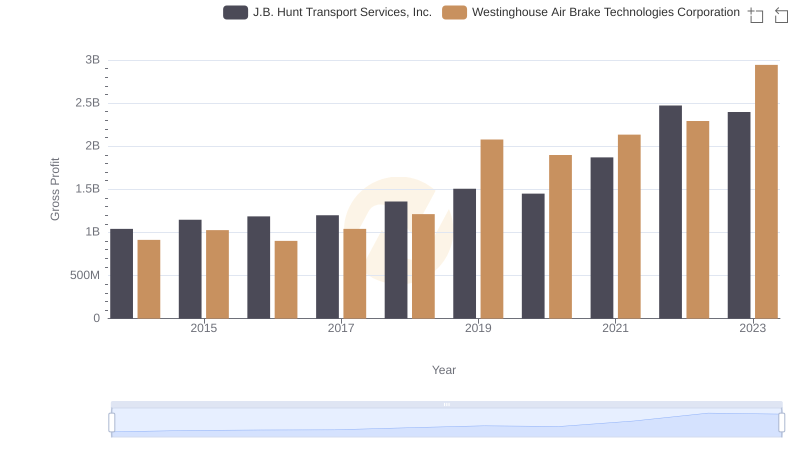
Westinghouse Air Brake Technologies Corporation vs J.B. Hunt Transport Services, Inc.: A Gross Profit Performance Breakdown
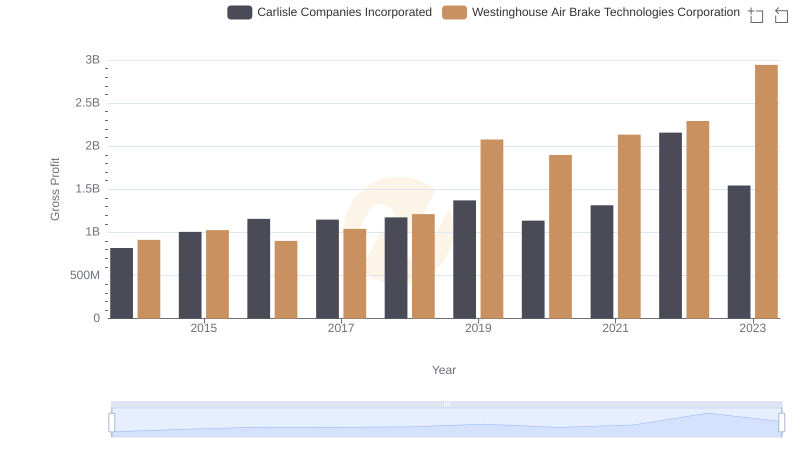
Westinghouse Air Brake Technologies Corporation and Carlisle Companies Incorporated: A Detailed Gross Profit Analysis
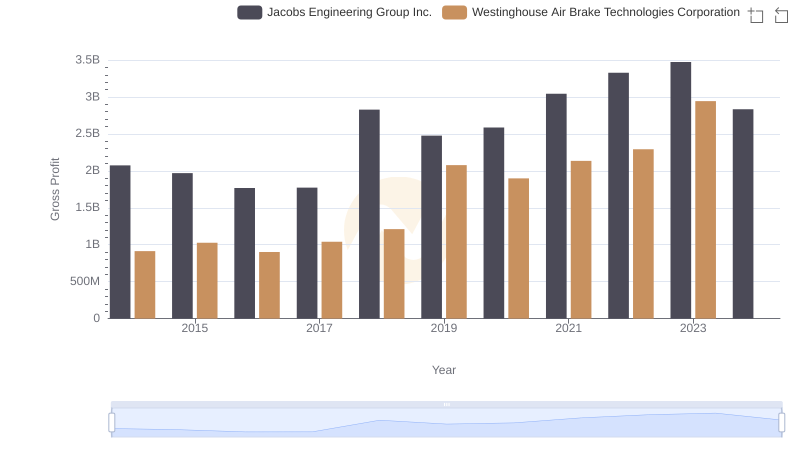
Key Insights on Gross Profit: Westinghouse Air Brake Technologies Corporation vs Jacobs Engineering Group Inc.
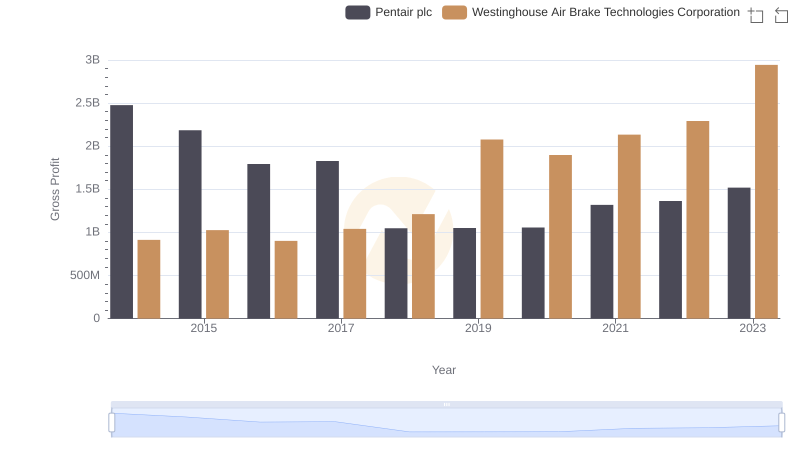
Gross Profit Comparison: Westinghouse Air Brake Technologies Corporation and Pentair plc Trends
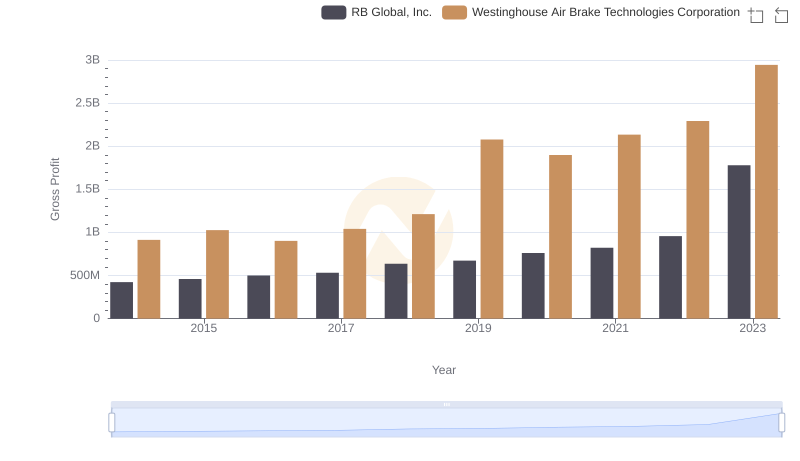
Gross Profit Comparison: Westinghouse Air Brake Technologies Corporation and RB Global, Inc. Trends
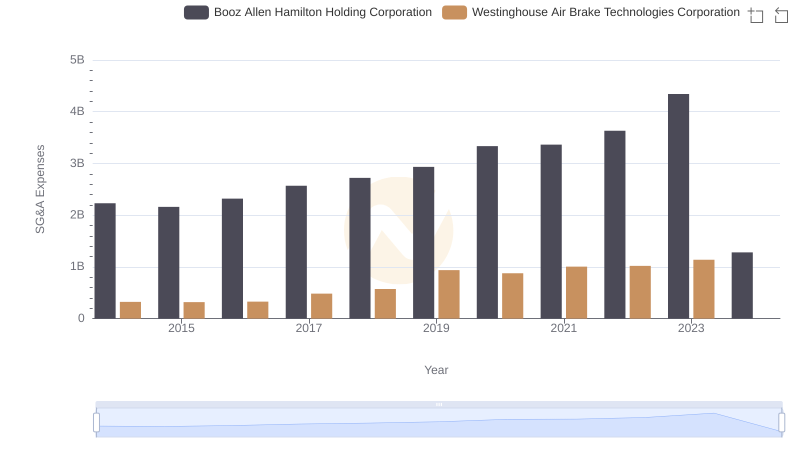
SG&A Efficiency Analysis: Comparing Westinghouse Air Brake Technologies Corporation and Booz Allen Hamilton Holding Corporation
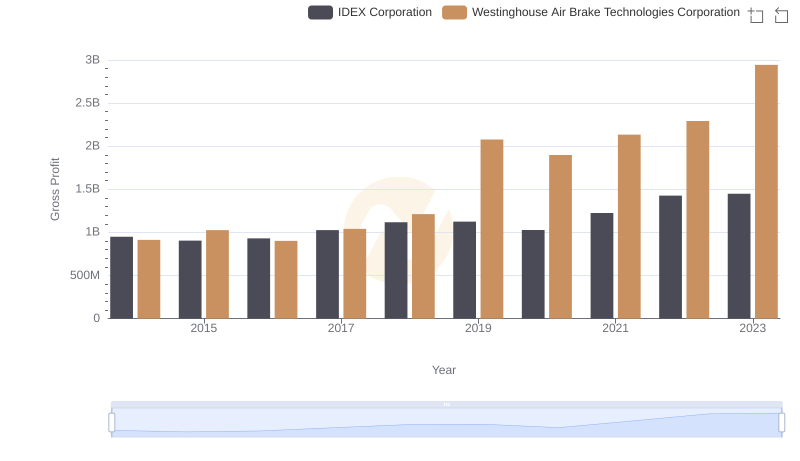
Key Insights on Gross Profit: Westinghouse Air Brake Technologies Corporation vs IDEX Corporation
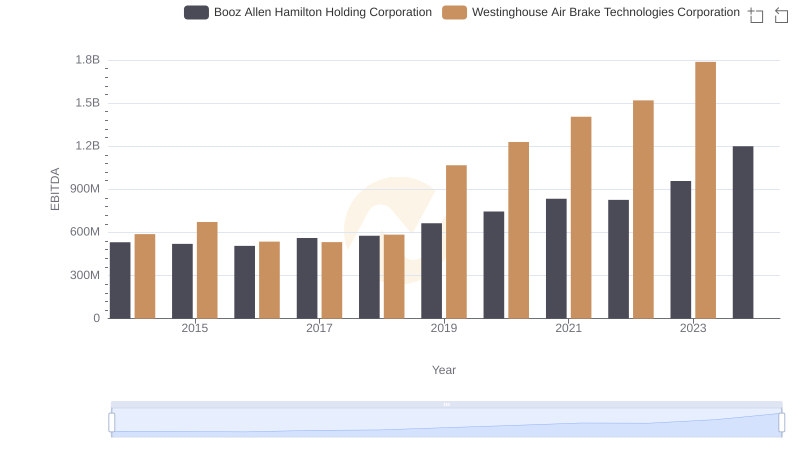
Comprehensive EBITDA Comparison: Westinghouse Air Brake Technologies Corporation vs Booz Allen Hamilton Holding Corporation