| __timestamp | Jacobs Engineering Group Inc. | Westinghouse Air Brake Technologies Corporation |
|---|---|---|
| Wednesday, January 1, 2014 | 699015000 | 588370000 |
| Thursday, January 1, 2015 | 598932000 | 672301000 |
| Friday, January 1, 2016 | 431954000 | 535893000 |
| Sunday, January 1, 2017 | 527765000 | 532795000 |
| Monday, January 1, 2018 | 606328000 | 584199000 |
| Tuesday, January 1, 2019 | 604075000 | 1067300000 |
| Wednesday, January 1, 2020 | 685042000 | 1229400000 |
| Friday, January 1, 2021 | 1019116000 | 1405000000 |
| Saturday, January 1, 2022 | 1277649000 | 1519000000 |
| Sunday, January 1, 2023 | 1392039000 | 1787000000 |
| Monday, January 1, 2024 | 1255083000 | 1609000000 |
Igniting the spark of knowledge
In the competitive landscape of industrial engineering, Westinghouse Air Brake Technologies Corporation and Jacobs Engineering Group Inc. have showcased remarkable EBITDA growth over the past decade. From 2014 to 2023, Westinghouse's EBITDA surged by approximately 204%, peaking in 2023, while Jacobs Engineering saw a robust 99% increase, reaching its zenith in the same year.
Westinghouse's EBITDA performance highlights a consistent upward trajectory, particularly from 2019 onwards, where it nearly doubled by 2023. Jacobs Engineering, although slightly more volatile, demonstrated a steady climb, with a notable spike in 2021.
While Westinghouse's 2024 data remains elusive, Jacobs Engineering's slight dip suggests potential market challenges. This missing data invites speculation on future trends and strategic shifts.
These insights underscore the dynamic nature of the industrial sector, where strategic decisions and market conditions drive financial outcomes.
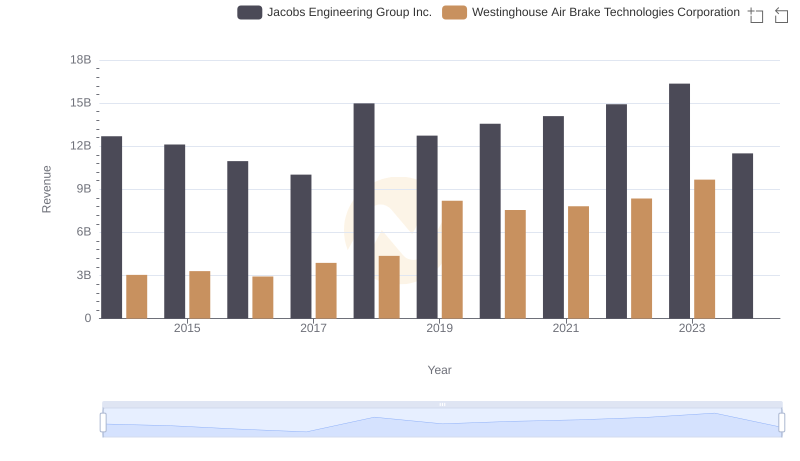
Who Generates More Revenue? Westinghouse Air Brake Technologies Corporation or Jacobs Engineering Group Inc.
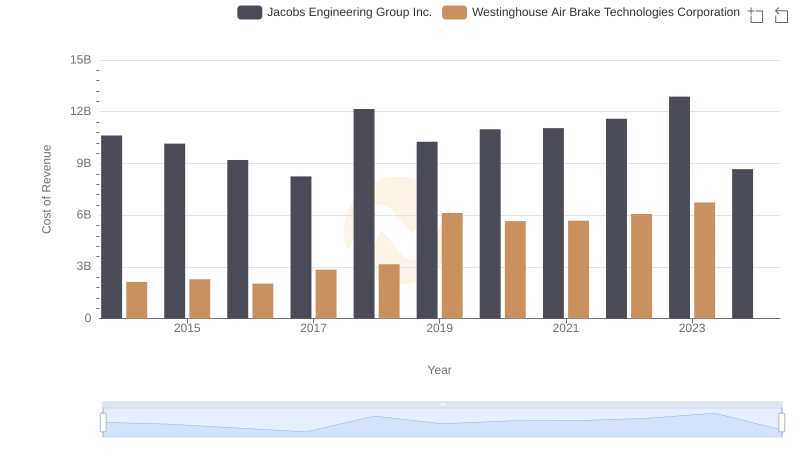
Cost Insights: Breaking Down Westinghouse Air Brake Technologies Corporation and Jacobs Engineering Group Inc.'s Expenses
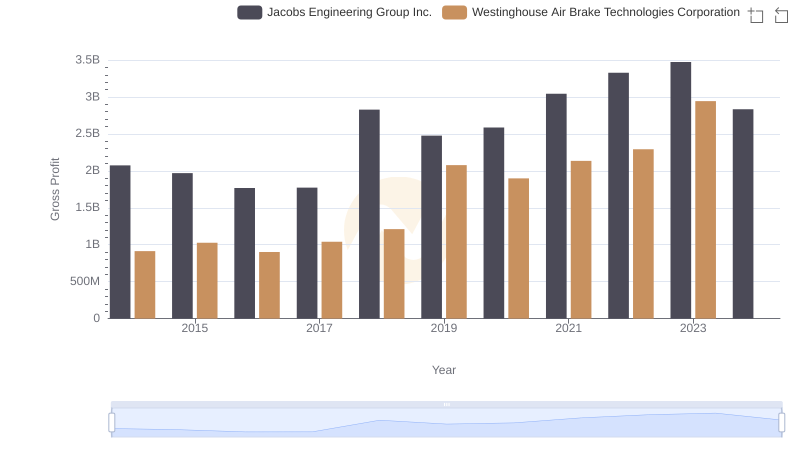
Key Insights on Gross Profit: Westinghouse Air Brake Technologies Corporation vs Jacobs Engineering Group Inc.
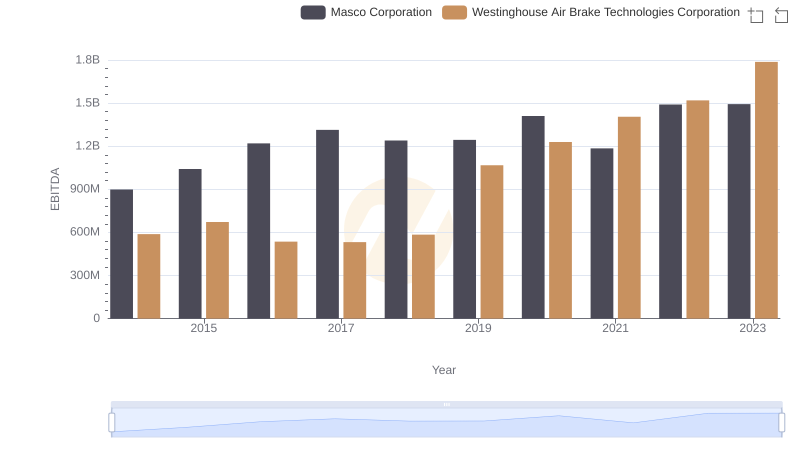
Comparative EBITDA Analysis: Westinghouse Air Brake Technologies Corporation vs Masco Corporation
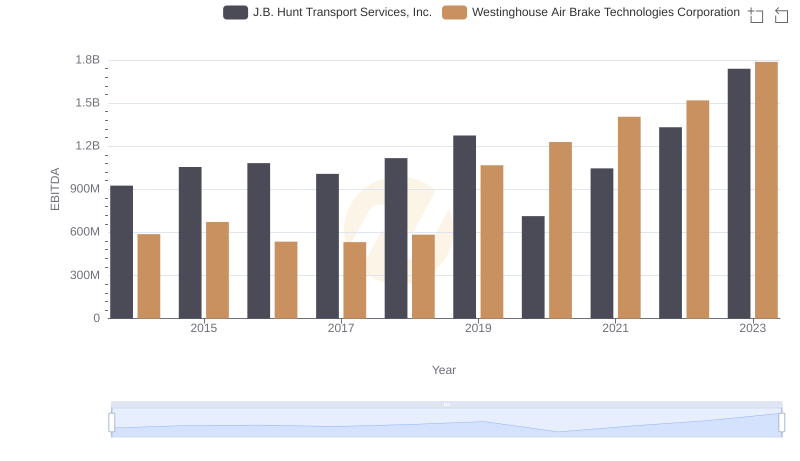
A Professional Review of EBITDA: Westinghouse Air Brake Technologies Corporation Compared to J.B. Hunt Transport Services, Inc.
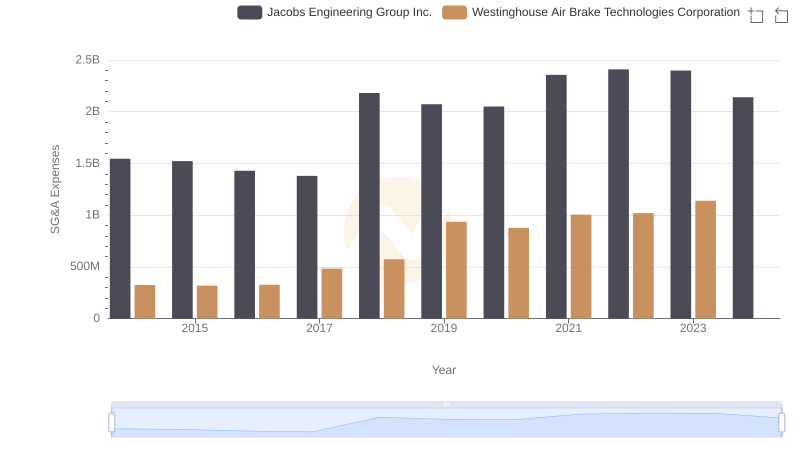
Comparing SG&A Expenses: Westinghouse Air Brake Technologies Corporation vs Jacobs Engineering Group Inc. Trends and Insights
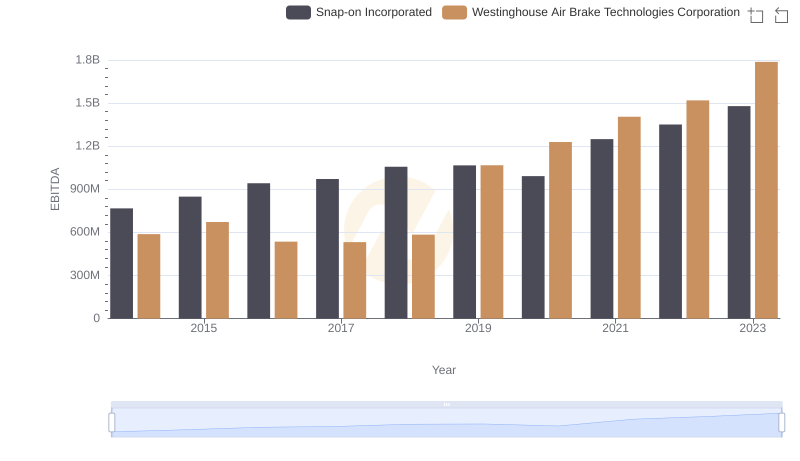
EBITDA Analysis: Evaluating Westinghouse Air Brake Technologies Corporation Against Snap-on Incorporated
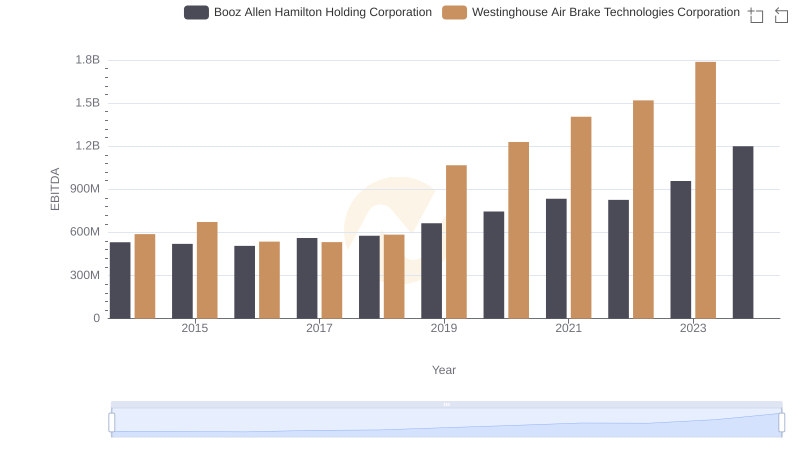
Comprehensive EBITDA Comparison: Westinghouse Air Brake Technologies Corporation vs Booz Allen Hamilton Holding Corporation
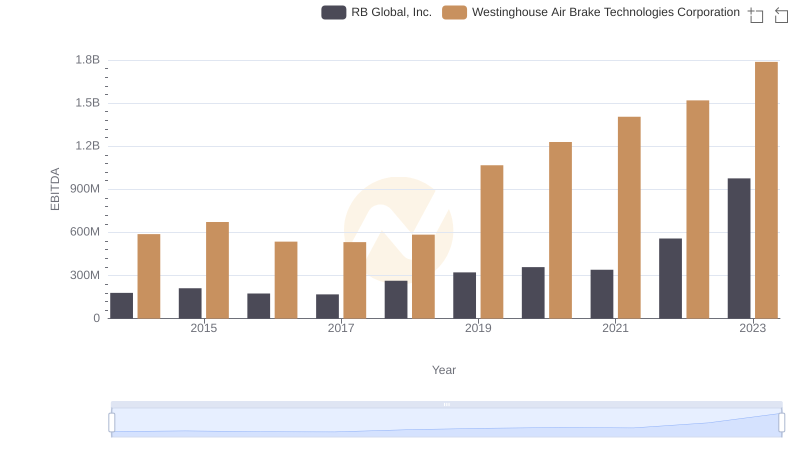
EBITDA Analysis: Evaluating Westinghouse Air Brake Technologies Corporation Against RB Global, Inc.
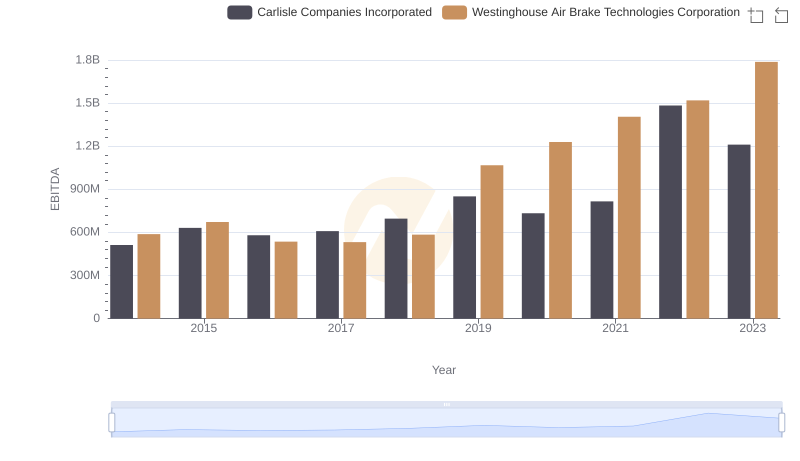
A Side-by-Side Analysis of EBITDA: Westinghouse Air Brake Technologies Corporation and Carlisle Companies Incorporated
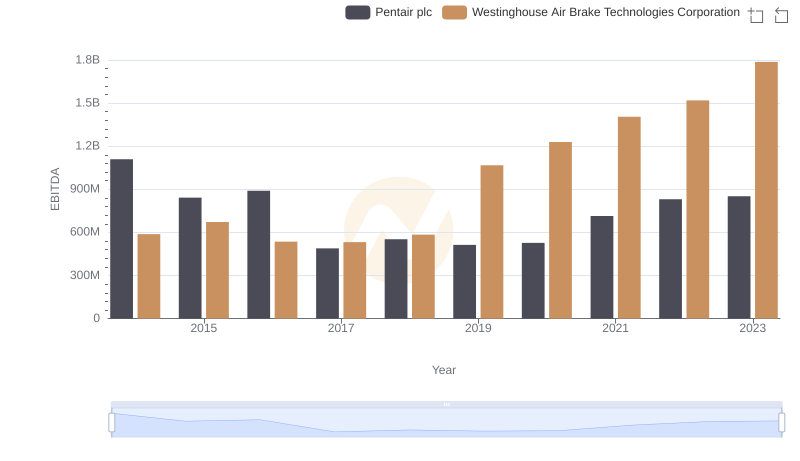
EBITDA Metrics Evaluated: Westinghouse Air Brake Technologies Corporation vs Pentair plc
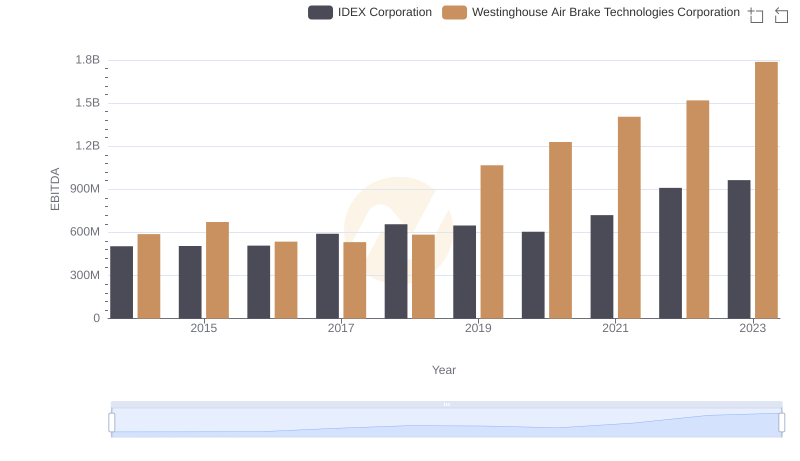
A Professional Review of EBITDA: Westinghouse Air Brake Technologies Corporation Compared to IDEX Corporation