| __timestamp | Old Dominion Freight Line, Inc. | Trane Technologies plc |
|---|---|---|
| Wednesday, January 1, 2014 | 585590000 | 1757000000 |
| Thursday, January 1, 2015 | 660570000 | 1835000000 |
| Friday, January 1, 2016 | 671786000 | 2311000000 |
| Sunday, January 1, 2017 | 783749000 | 1982500000 |
| Monday, January 1, 2018 | 1046059000 | 2242400000 |
| Tuesday, January 1, 2019 | 1078007000 | 1931200000 |
| Wednesday, January 1, 2020 | 1168149000 | 1831900000 |
| Friday, January 1, 2021 | 1651501000 | 2319200000 |
| Saturday, January 1, 2022 | 2118962000 | 2715500000 |
| Sunday, January 1, 2023 | 1972689000 | 3149900000 |
| Monday, January 1, 2024 | 3859600000 |
Igniting the spark of knowledge
In the ever-evolving landscape of industrial giants, Trane Technologies plc and Old Dominion Freight Line, Inc. have showcased remarkable EBITDA growth over the past decade. From 2014 to 2023, Trane Technologies consistently outperformed, with an average EBITDA of approximately $2.2 billion, peaking at $3.15 billion in 2023. This represents a robust 79% increase from its 2014 figures.
Old Dominion Freight Line, while trailing, demonstrated impressive growth, with its EBITDA surging by 237% from 2014 to 2022, before a slight dip in 2023. This growth trajectory underscores the company's resilience and strategic prowess in the freight industry.
These metrics not only highlight the financial health of these companies but also reflect broader industry trends, where innovation and operational efficiency are key drivers of success. As we look to the future, these companies remain pivotal players in their respective sectors.
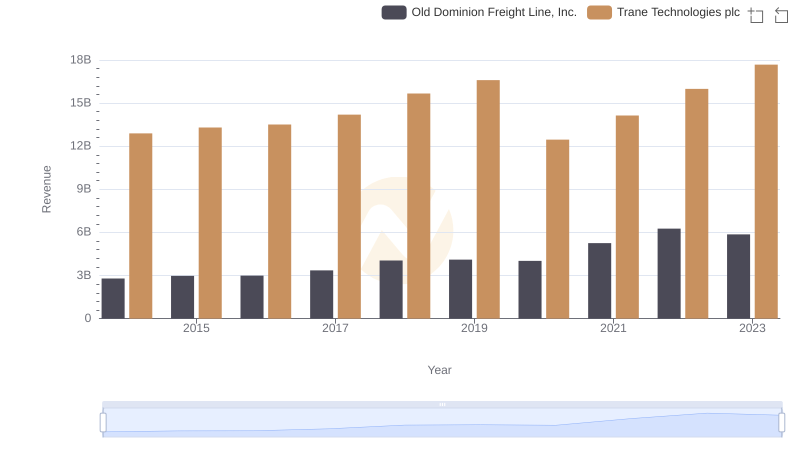
Annual Revenue Comparison: Trane Technologies plc vs Old Dominion Freight Line, Inc.
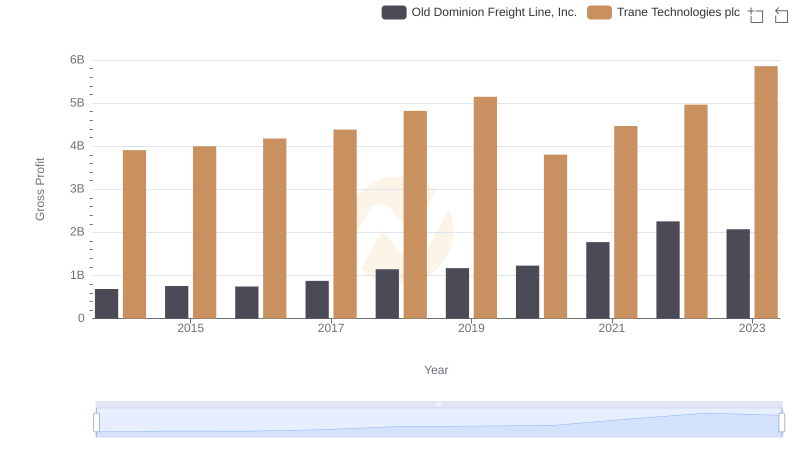
Key Insights on Gross Profit: Trane Technologies plc vs Old Dominion Freight Line, Inc.
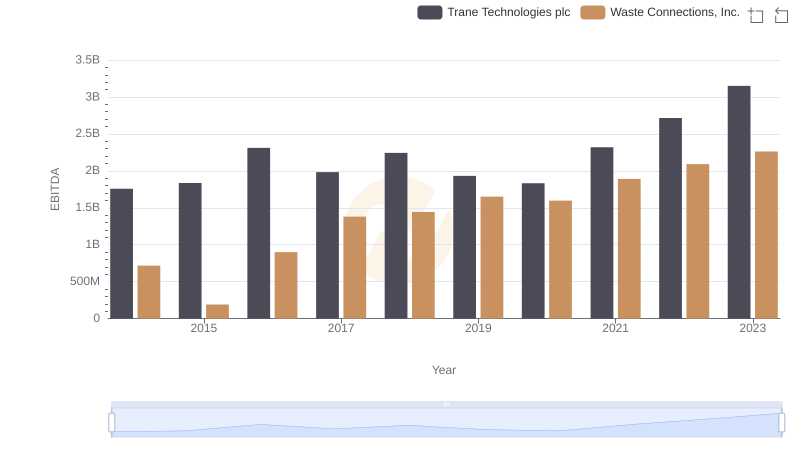
Trane Technologies plc and Waste Connections, Inc.: A Detailed Examination of EBITDA Performance
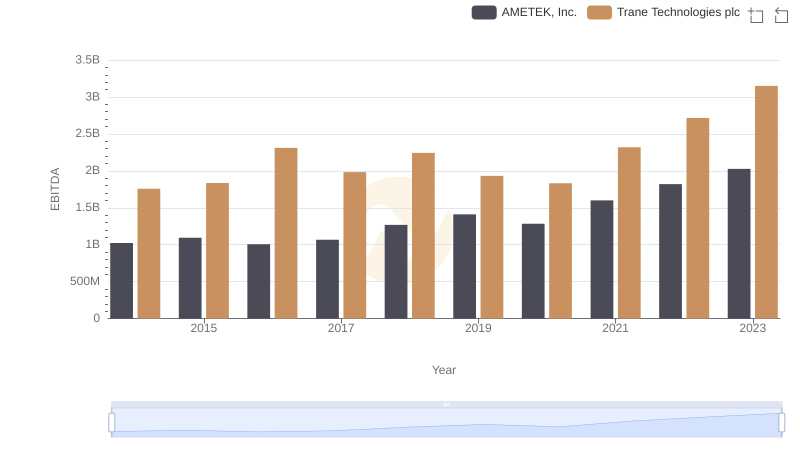
EBITDA Performance Review: Trane Technologies plc vs AMETEK, Inc.
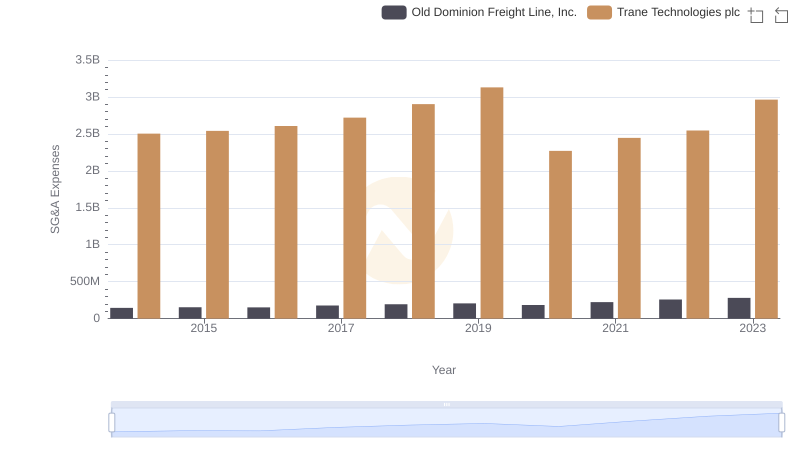
Trane Technologies plc or Old Dominion Freight Line, Inc.: Who Manages SG&A Costs Better?
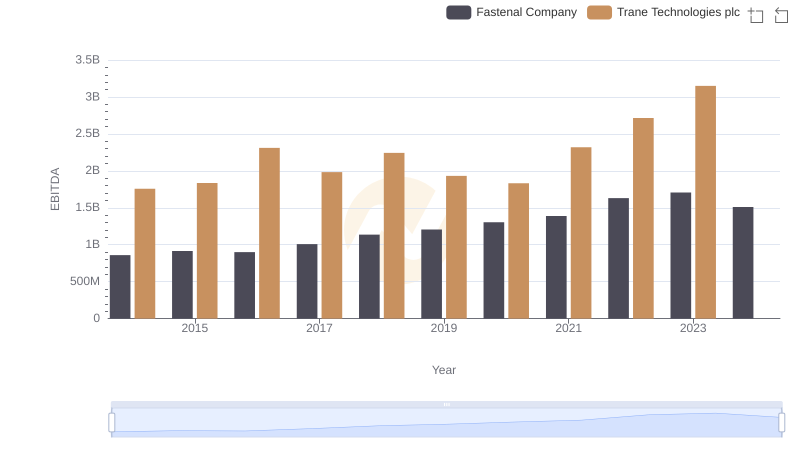
Trane Technologies plc and Fastenal Company: A Detailed Examination of EBITDA Performance
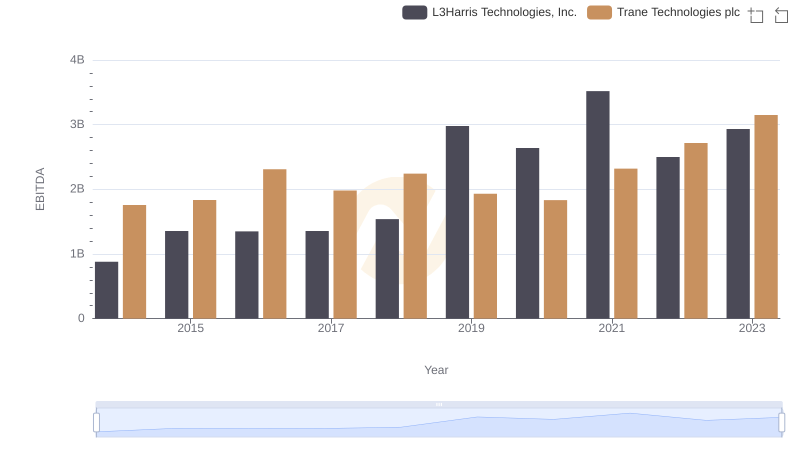
Comparative EBITDA Analysis: Trane Technologies plc vs L3Harris Technologies, Inc.
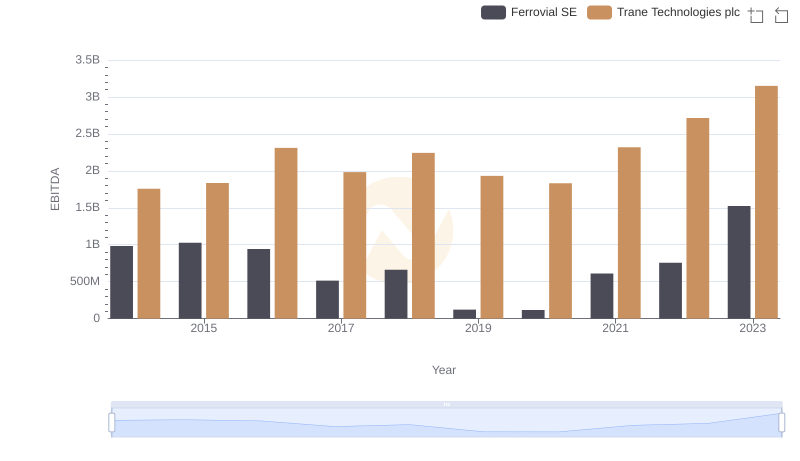
Professional EBITDA Benchmarking: Trane Technologies plc vs Ferrovial SE