| __timestamp | Guidewire Software, Inc. | QUALCOMM Incorporated |
|---|---|---|
| Wednesday, January 1, 2014 | 201299000 | 15801000000 |
| Thursday, January 1, 2015 | 233353000 | 14903000000 |
| Friday, January 1, 2016 | 272612000 | 13805000000 |
| Sunday, January 1, 2017 | 322725000 | 12499000000 |
| Monday, January 1, 2018 | 364360000 | 12488000000 |
| Tuesday, January 1, 2019 | 395164000 | 15674000000 |
| Wednesday, January 1, 2020 | 404292000 | 14276000000 |
| Friday, January 1, 2021 | 368213000 | 19304000000 |
| Saturday, January 1, 2022 | 352220000 | 25565000000 |
| Sunday, January 1, 2023 | 458211000 | 19951000000 |
| Monday, January 1, 2024 | 583361000 | 21902000000 |
Data in motion
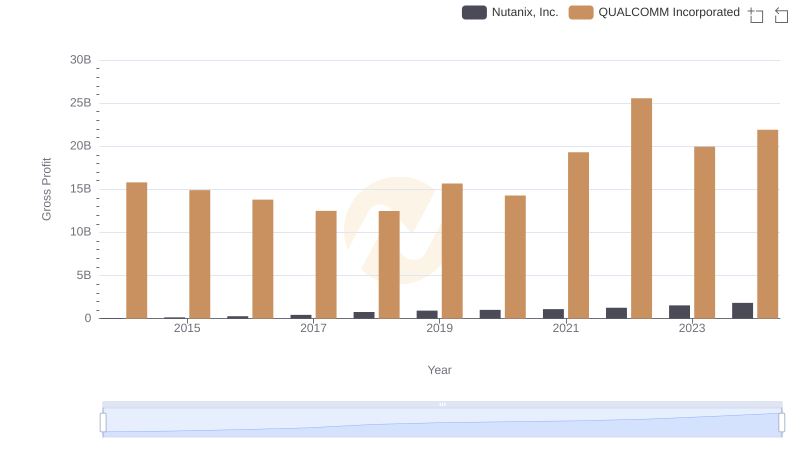
In the ever-evolving landscape of technology, the financial performance of companies like QUALCOMM Incorporated and Guidewire Software, Inc. offers a fascinating glimpse into industry dynamics. Over the past decade, QUALCOMM has consistently outperformed Guidewire in terms of gross profit, showcasing its dominance in the semiconductor sector. From 2014 to 2024, QUALCOMM's gross profit surged by approximately 39%, peaking at $25.6 billion in 2022. In contrast, Guidewire, a leader in software solutions for the insurance industry, experienced a more modest growth of around 190%, reaching $583 million in 2024.
This stark contrast highlights the differing scales and market influences of these two companies. While QUALCOMM's growth reflects its pivotal role in the global tech supply chain, Guidewire's steady rise underscores its niche expertise and resilience in a competitive market. As we look to the future, these trends offer valuable insights into the strategic directions of these industry leaders.

Gross Profit Comparison: QUALCOMM Incorporated and Teradyne, Inc. Trends
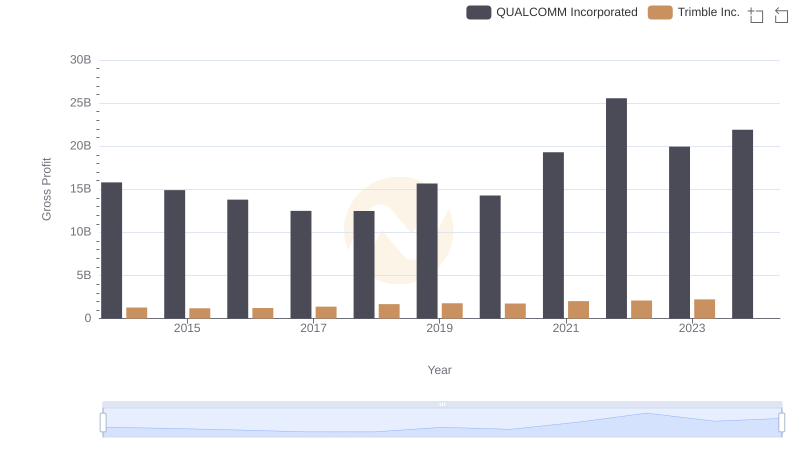
Gross Profit Trends Compared: QUALCOMM Incorporated vs Trimble Inc.
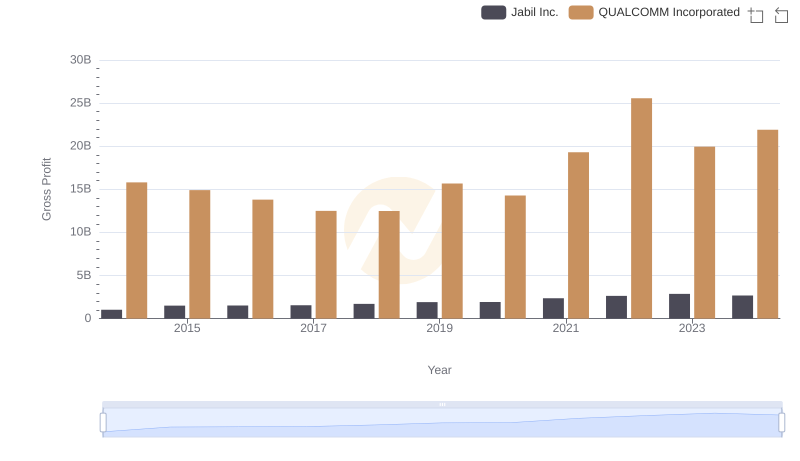
QUALCOMM Incorporated vs Jabil Inc.: A Gross Profit Performance Breakdown
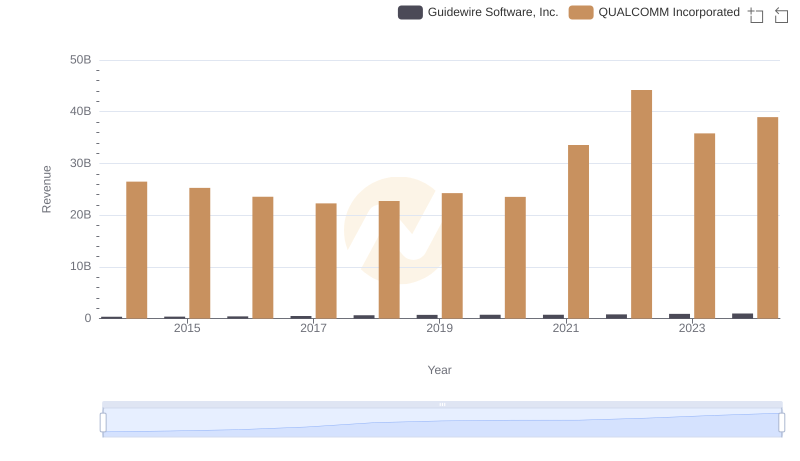
Comparing Revenue Performance: QUALCOMM Incorporated or Guidewire Software, Inc.?
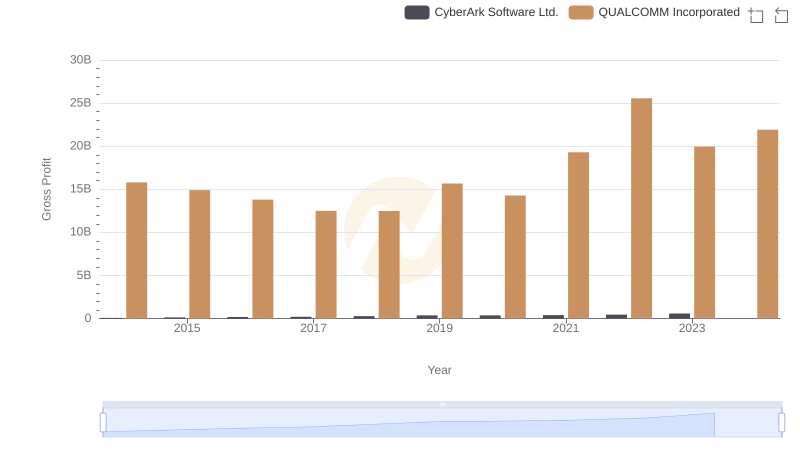
Key Insights on Gross Profit: QUALCOMM Incorporated vs CyberArk Software Ltd.
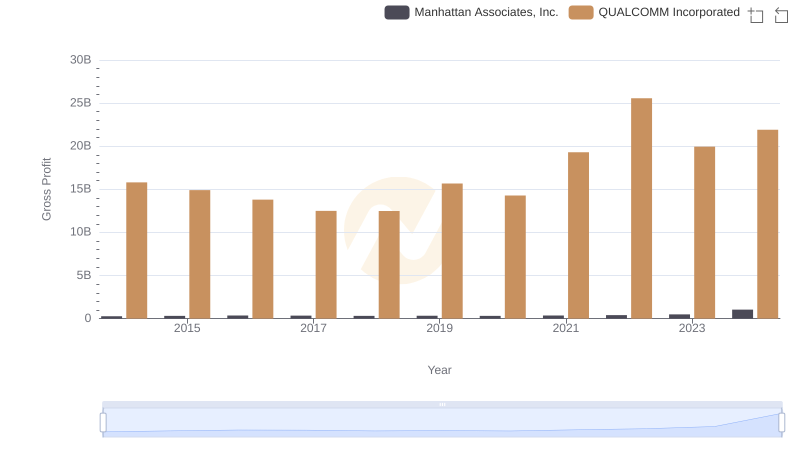
Gross Profit Analysis: Comparing QUALCOMM Incorporated and Manhattan Associates, Inc.
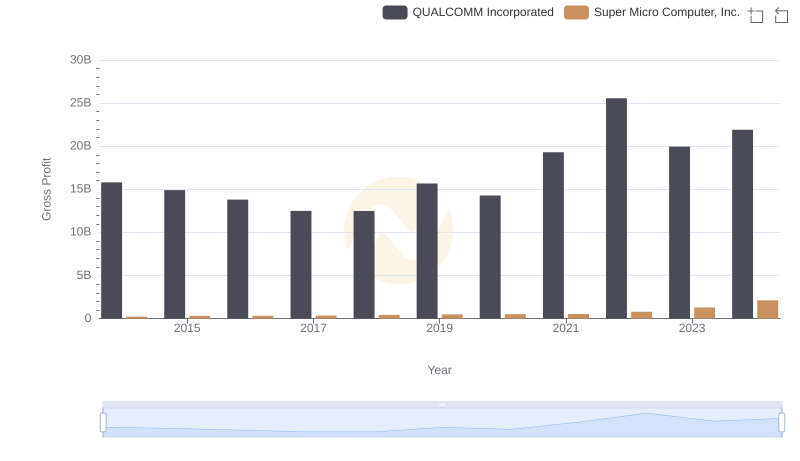
Gross Profit Trends Compared: QUALCOMM Incorporated vs Super Micro Computer, Inc.
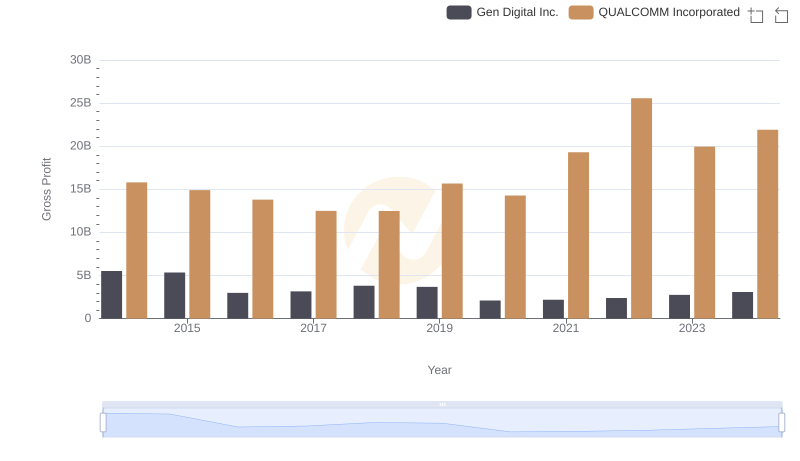
Key Insights on Gross Profit: QUALCOMM Incorporated vs Gen Digital Inc.
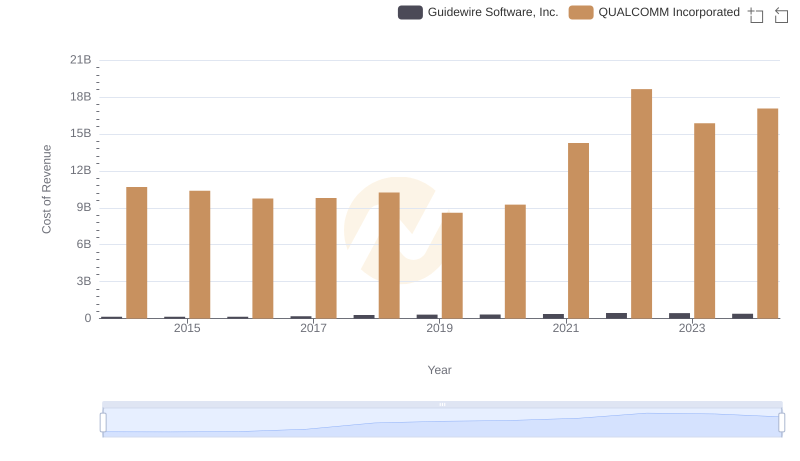
Cost of Revenue Trends: QUALCOMM Incorporated vs Guidewire Software, Inc.
Gross Profit Trends Compared: QUALCOMM Incorporated vs Nutanix, Inc.
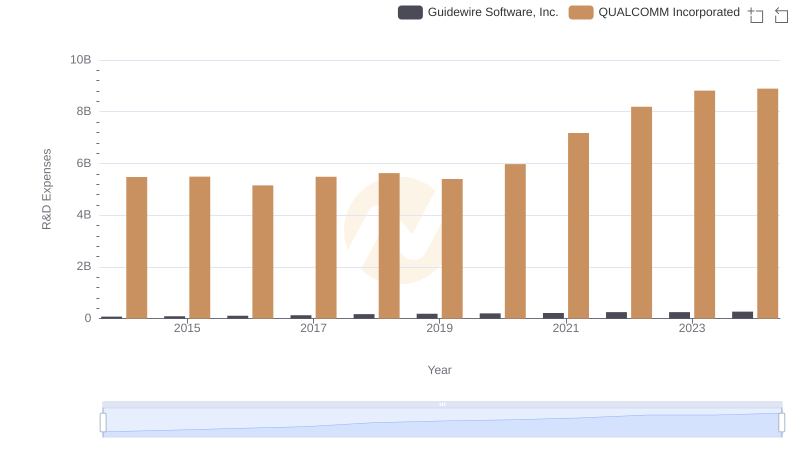
R&D Spending Showdown: QUALCOMM Incorporated vs Guidewire Software, Inc.
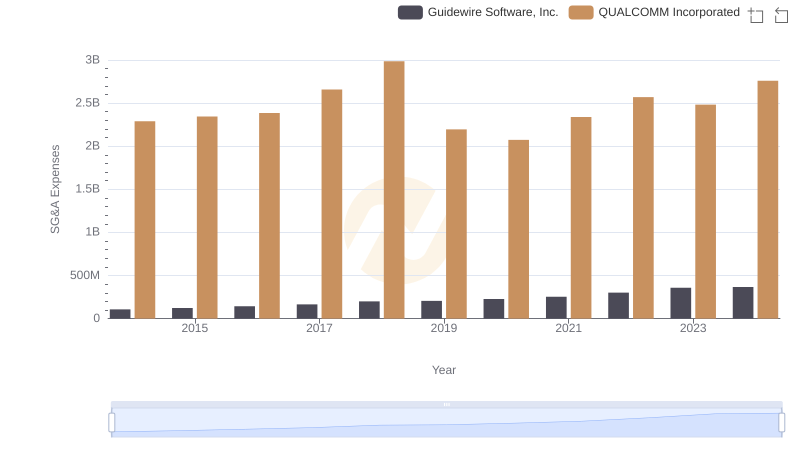
QUALCOMM Incorporated or Guidewire Software, Inc.: Who Manages SG&A Costs Better?