| __timestamp | QUALCOMM Incorporated | Super Micro Computer, Inc. |
|---|---|---|
| Wednesday, January 1, 2014 | 15801000000 | 225545000 |
| Thursday, January 1, 2015 | 14903000000 | 320231000 |
| Friday, January 1, 2016 | 13805000000 | 331525000 |
| Sunday, January 1, 2017 | 12499000000 | 358566000 |
| Monday, January 1, 2018 | 12488000000 | 429994000 |
| Tuesday, January 1, 2019 | 15674000000 | 495522000 |
| Wednesday, January 1, 2020 | 14276000000 | 526210000 |
| Friday, January 1, 2021 | 19304000000 | 534538000 |
| Saturday, January 1, 2022 | 25565000000 | 800001000 |
| Sunday, January 1, 2023 | 19951000000 | 1283012000 |
| Monday, January 1, 2024 | 21902000000 | 2111729000 |
Unleashing the power of data
In the ever-evolving landscape of technology, the financial performance of industry leaders offers a window into broader market trends. Over the past decade, QUALCOMM Incorporated and Super Micro Computer, Inc. have showcased contrasting trajectories in gross profit growth. From 2014 to 2024, QUALCOMM's gross profit surged by approximately 39%, peaking in 2022. This growth reflects its strategic innovations and market adaptability. In contrast, Super Micro Computer, Inc. experienced a remarkable 837% increase, highlighting its aggressive expansion and niche market capture. Notably, 2023 marked a pivotal year for both companies, with Super Micro's gross profit reaching over $1.28 billion, a significant leap from its 2014 figures. As we look to the future, these trends underscore the dynamic nature of the tech industry, where agility and innovation remain key to sustained success.
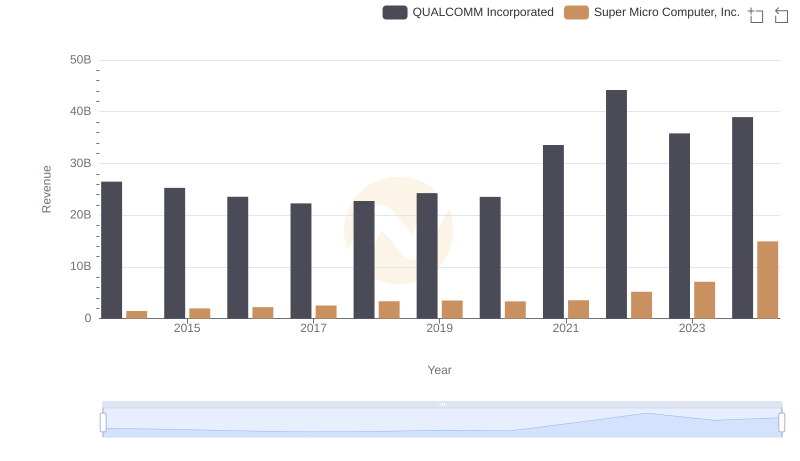
Revenue Insights: QUALCOMM Incorporated and Super Micro Computer, Inc. Performance Compared
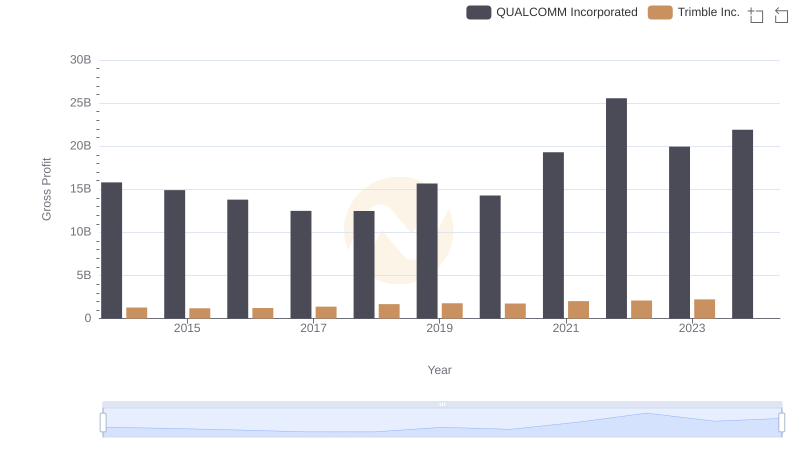
Gross Profit Trends Compared: QUALCOMM Incorporated vs Trimble Inc.
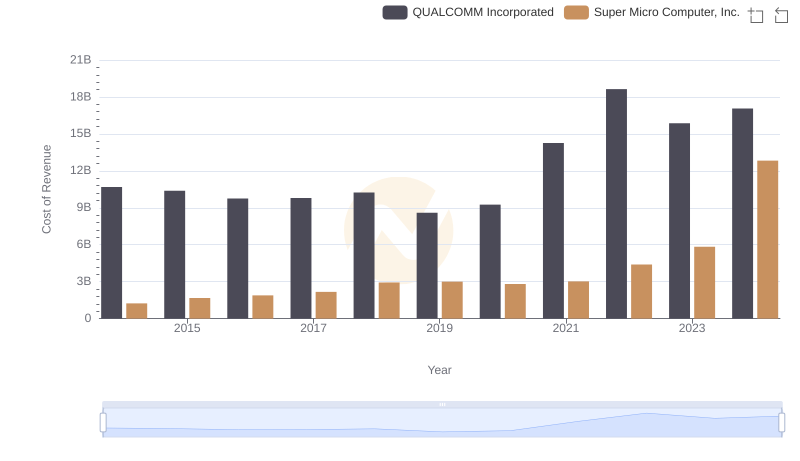
Cost of Revenue: Key Insights for QUALCOMM Incorporated and Super Micro Computer, Inc.
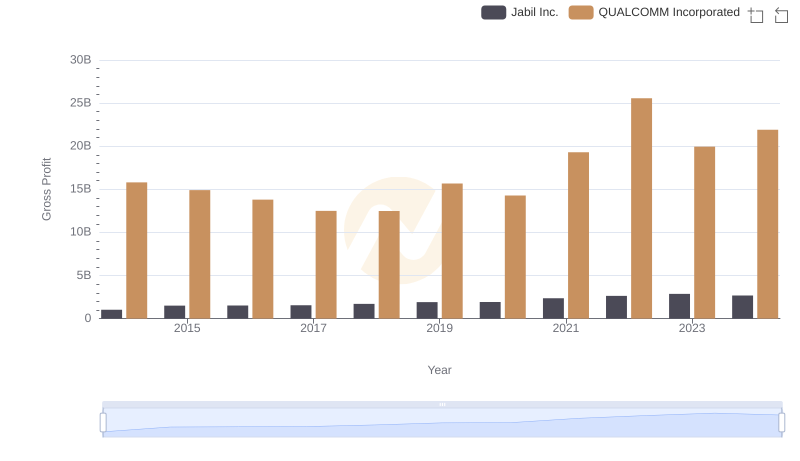
QUALCOMM Incorporated vs Jabil Inc.: A Gross Profit Performance Breakdown
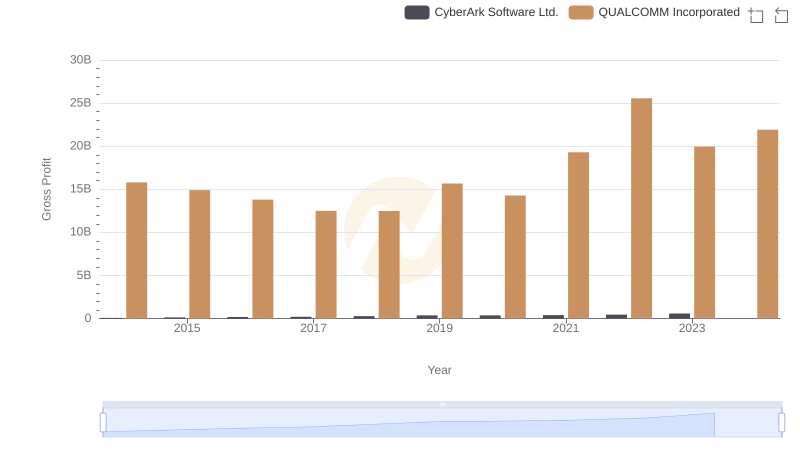
Key Insights on Gross Profit: QUALCOMM Incorporated vs CyberArk Software Ltd.
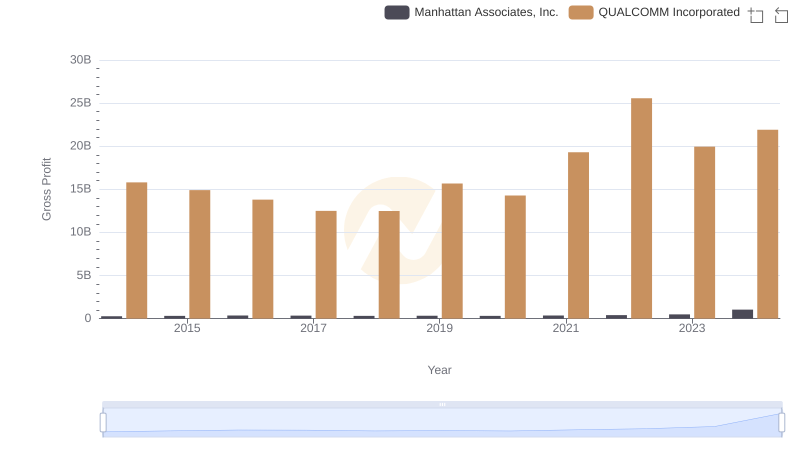
Gross Profit Analysis: Comparing QUALCOMM Incorporated and Manhattan Associates, Inc.
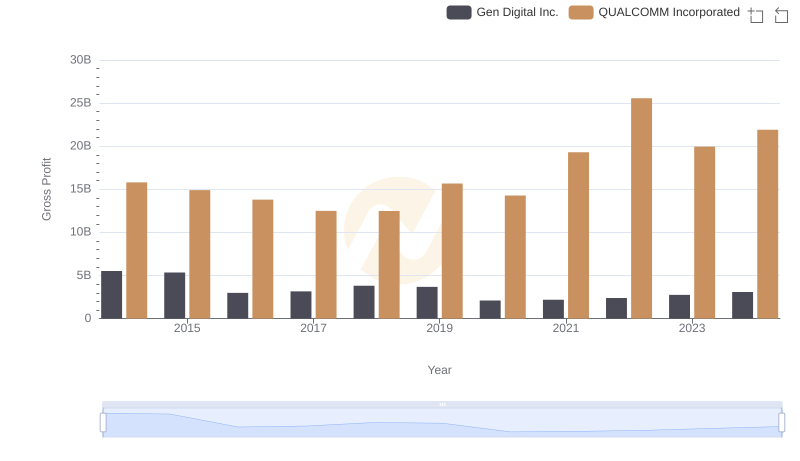
Key Insights on Gross Profit: QUALCOMM Incorporated vs Gen Digital Inc.
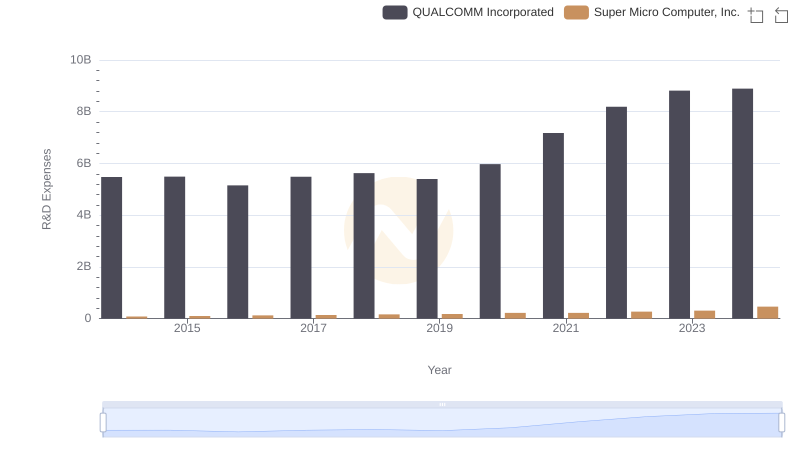
QUALCOMM Incorporated vs Super Micro Computer, Inc.: Strategic Focus on R&D Spending
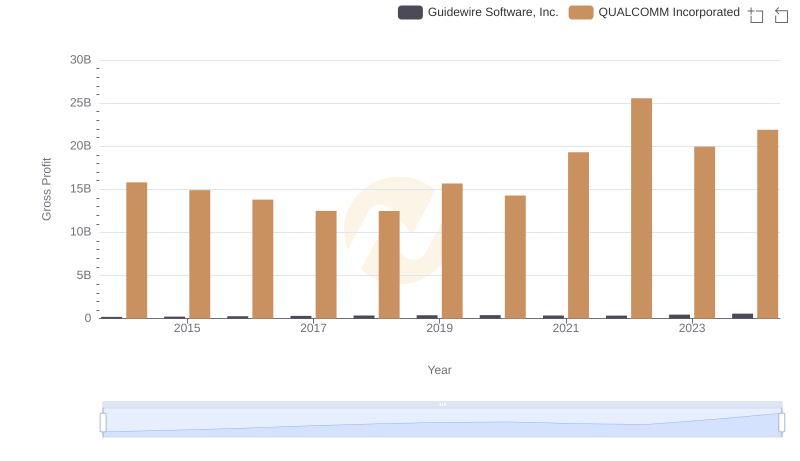
QUALCOMM Incorporated vs Guidewire Software, Inc.: A Gross Profit Performance Breakdown
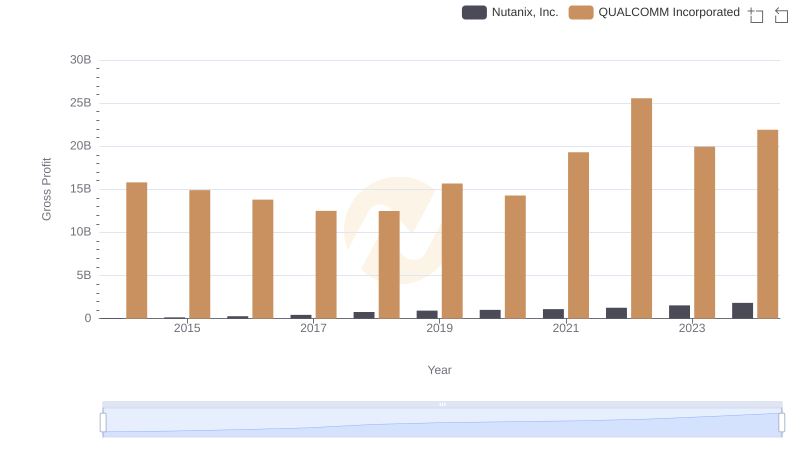
Gross Profit Trends Compared: QUALCOMM Incorporated vs Nutanix, Inc.
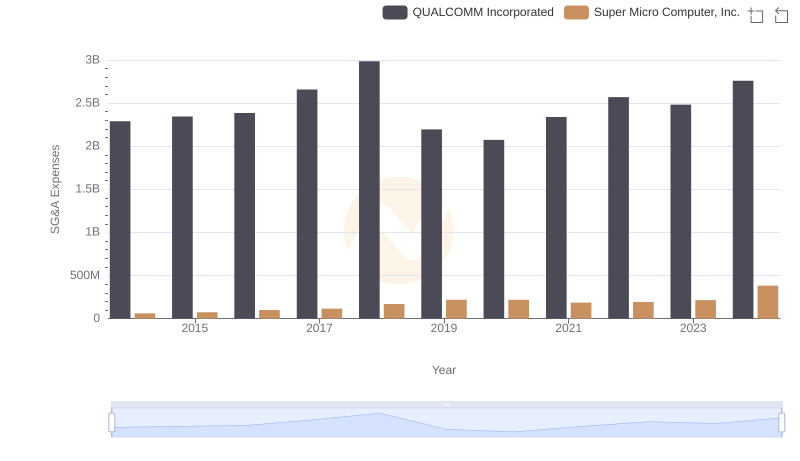
QUALCOMM Incorporated and Super Micro Computer, Inc.: SG&A Spending Patterns Compared
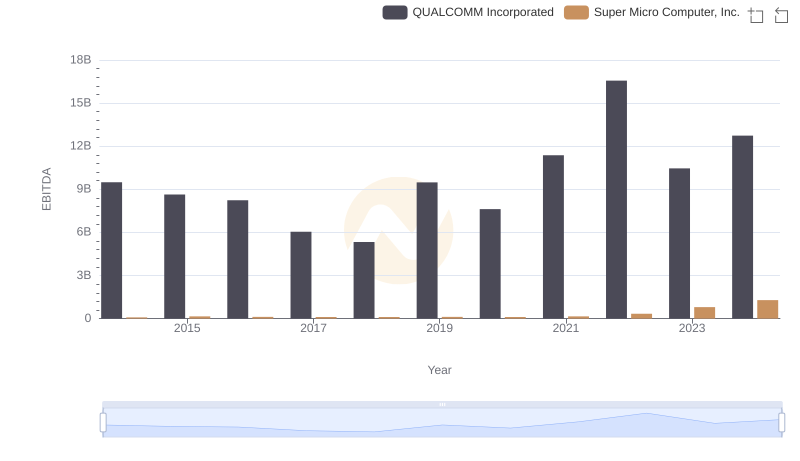
Comparative EBITDA Analysis: QUALCOMM Incorporated vs Super Micro Computer, Inc.