| __timestamp | Intuit Inc. | Nutanix, Inc. |
|---|---|---|
| Wednesday, January 1, 2014 | 3838000000 | 66215000 |
| Thursday, January 1, 2015 | 3467000000 | 140473000 |
| Friday, January 1, 2016 | 3942000000 | 274141000 |
| Sunday, January 1, 2017 | 4368000000 | 439538000 |
| Monday, January 1, 2018 | 4987000000 | 769427000 |
| Tuesday, January 1, 2019 | 5617000000 | 932015000 |
| Wednesday, January 1, 2020 | 6301000000 | 1020993000 |
| Friday, January 1, 2021 | 7950000000 | 1102458000 |
| Saturday, January 1, 2022 | 10320000000 | 1259640000 |
| Sunday, January 1, 2023 | 11225000000 | 1530708000 |
| Monday, January 1, 2024 | 12820000000 | 1824704000 |
Data in motion
In the ever-evolving landscape of technology, Intuit Inc. and Nutanix, Inc. have showcased remarkable growth in their gross profits over the past decade. From 2014 to 2024, Intuit's gross profit surged by over 230%, reflecting its robust business model and strategic innovations. In contrast, Nutanix, a relatively newer player, demonstrated an impressive growth of nearly 2,700% during the same period, highlighting its rapid expansion and increasing market presence.
These trends reflect the companies' strategic adaptations and market resilience, making them key players to watch in the coming years.
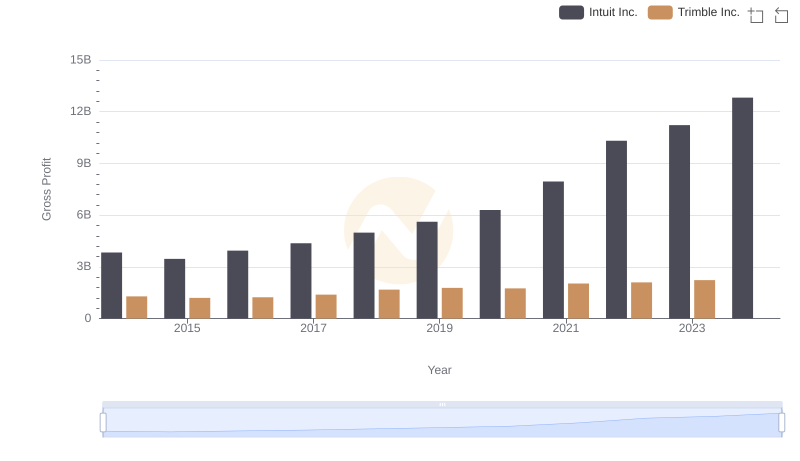
Key Insights on Gross Profit: Intuit Inc. vs Trimble Inc.
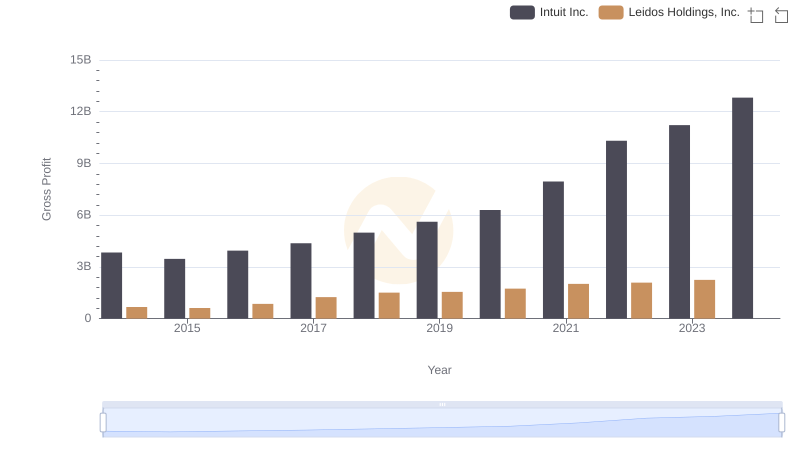
Intuit Inc. and Leidos Holdings, Inc.: A Detailed Gross Profit Analysis
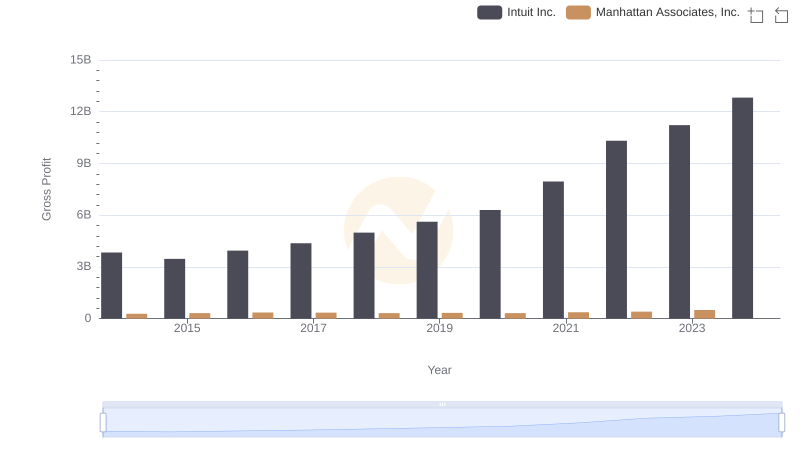
Gross Profit Trends Compared: Intuit Inc. vs Manhattan Associates, Inc.
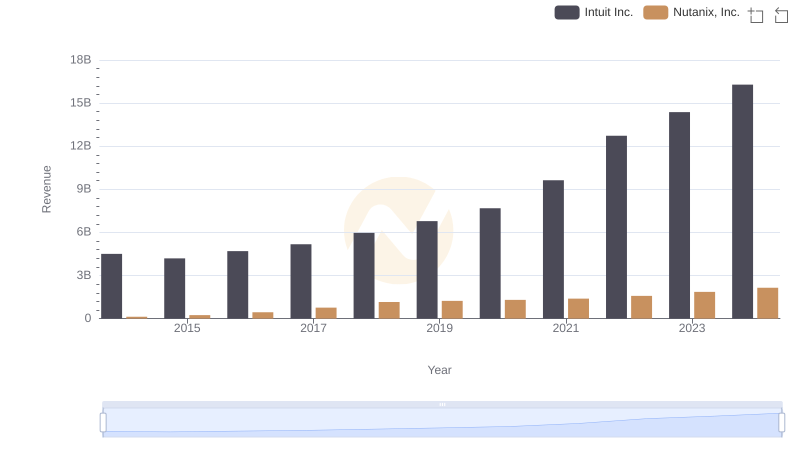
Breaking Down Revenue Trends: Intuit Inc. vs Nutanix, Inc.
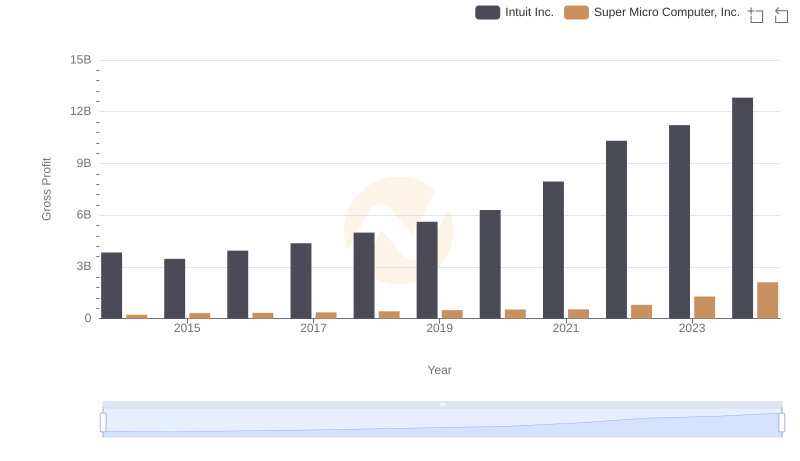
Gross Profit Analysis: Comparing Intuit Inc. and Super Micro Computer, Inc.
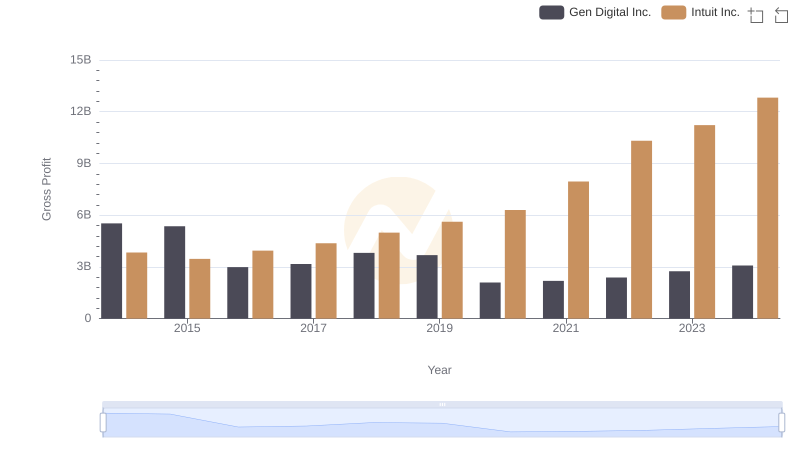
Intuit Inc. vs Gen Digital Inc.: A Gross Profit Performance Breakdown
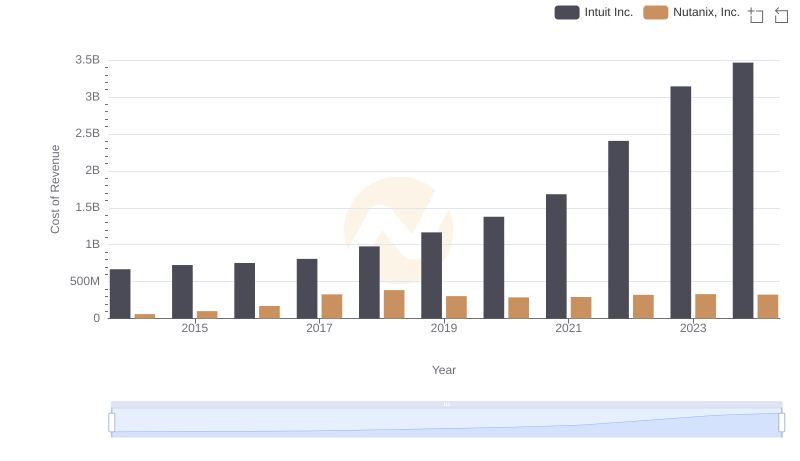
Intuit Inc. vs Nutanix, Inc.: Efficiency in Cost of Revenue Explored
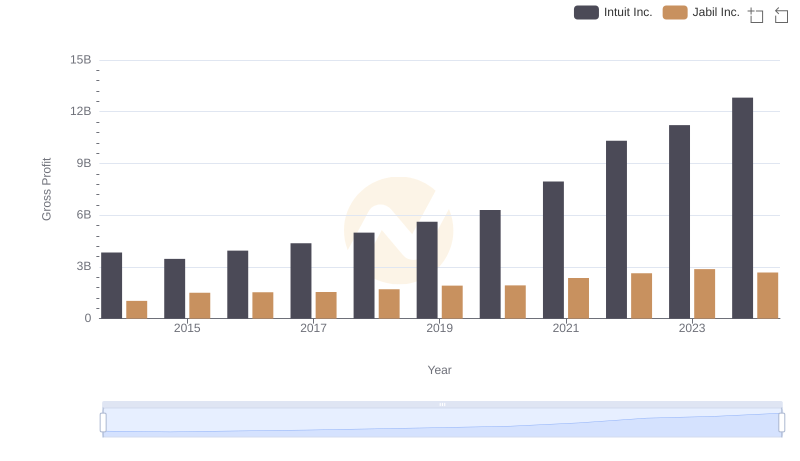
Gross Profit Trends Compared: Intuit Inc. vs Jabil Inc.
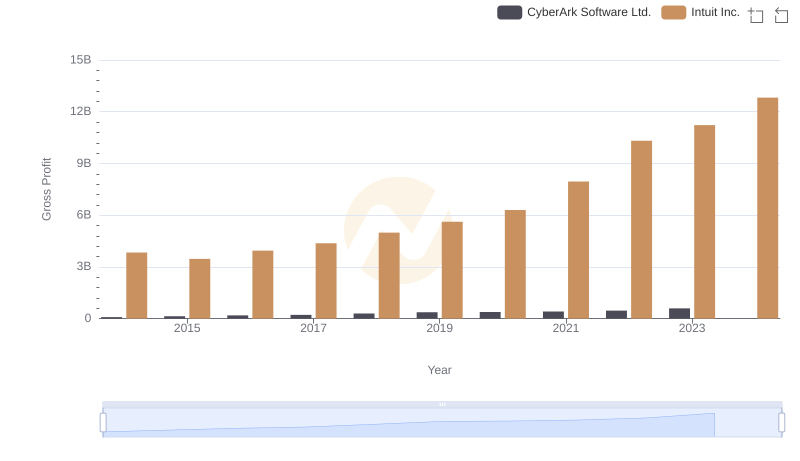
Gross Profit Analysis: Comparing Intuit Inc. and CyberArk Software Ltd.
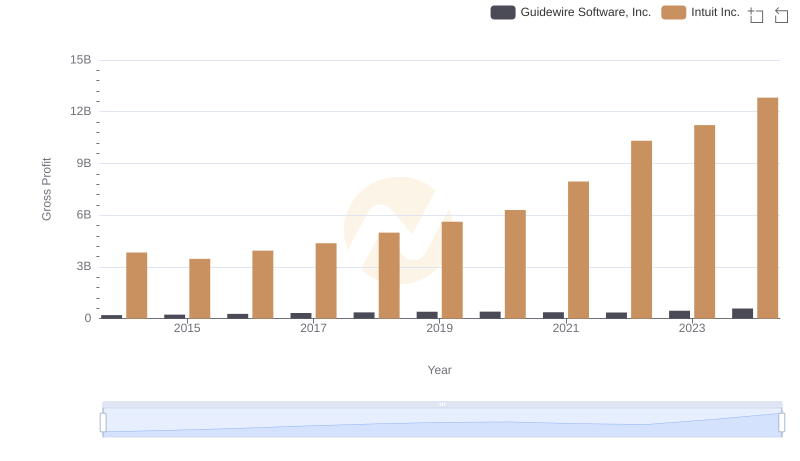
Gross Profit Analysis: Comparing Intuit Inc. and Guidewire Software, Inc.
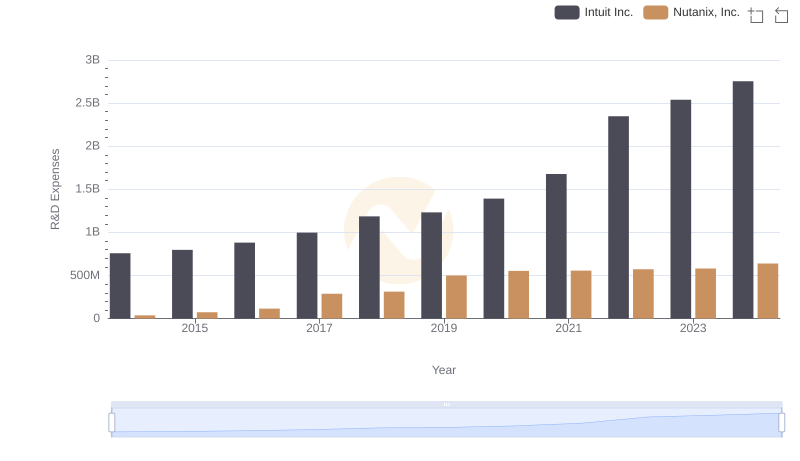
R&D Insights: How Intuit Inc. and Nutanix, Inc. Allocate Funds
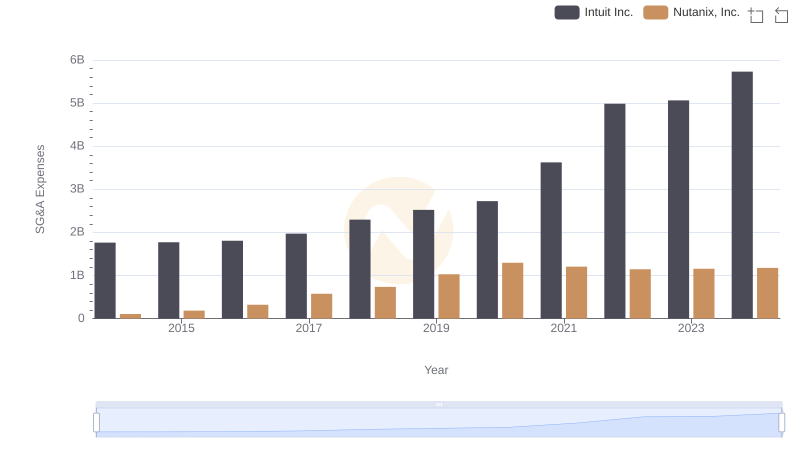
Who Optimizes SG&A Costs Better? Intuit Inc. or Nutanix, Inc.