| __timestamp | International Business Machines Corporation | Jabil Inc. |
|---|---|---|
| Wednesday, January 1, 2014 | 46407000000 | 1025603000 |
| Thursday, January 1, 2015 | 40684000000 | 1503218000 |
| Friday, January 1, 2016 | 38516000000 | 1527704000 |
| Sunday, January 1, 2017 | 36943000000 | 1545643000 |
| Monday, January 1, 2018 | 36936000000 | 1706792000 |
| Tuesday, January 1, 2019 | 31533000000 | 1913401000 |
| Wednesday, January 1, 2020 | 30865000000 | 1930813000 |
| Friday, January 1, 2021 | 31486000000 | 2359000000 |
| Saturday, January 1, 2022 | 32687000000 | 2632000000 |
| Sunday, January 1, 2023 | 34300000000 | 2867000000 |
| Monday, January 1, 2024 | 35551000000 | 2676000000 |
Unleashing insights
In the ever-evolving landscape of technology and manufacturing, International Business Machines Corporation (IBM) and Jabil Inc. stand as titans in their respective fields. Over the past decade, IBM's gross profit has seen a decline of approximately 26%, from a peak in 2014 to a low in 2021. This trend reflects the company's strategic shifts and market challenges. Conversely, Jabil Inc. has experienced a robust growth trajectory, with its gross profit increasing by nearly 180% from 2014 to 2023. This growth underscores Jabil's adaptability and expansion in the global market.
These insights offer a glimpse into the dynamic interplay of strategy and market forces shaping these industry leaders.
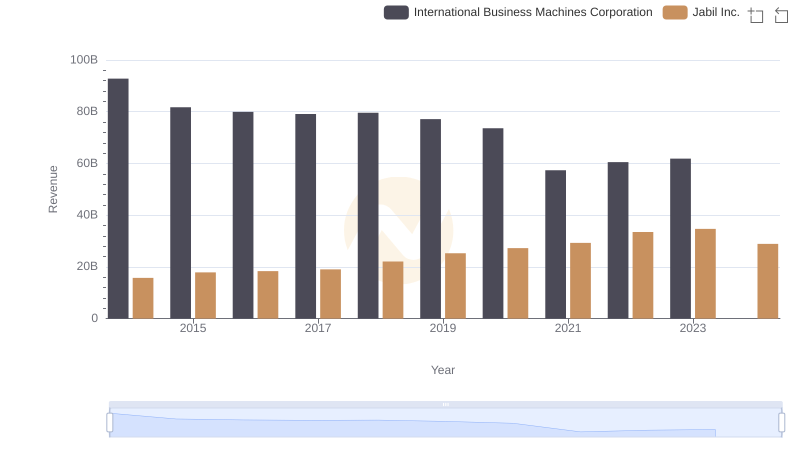
International Business Machines Corporation vs Jabil Inc.: Examining Key Revenue Metrics
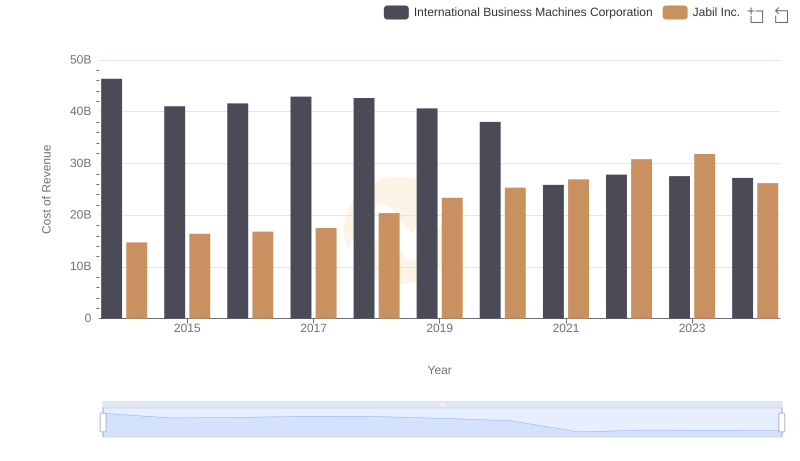
Analyzing Cost of Revenue: International Business Machines Corporation and Jabil Inc.
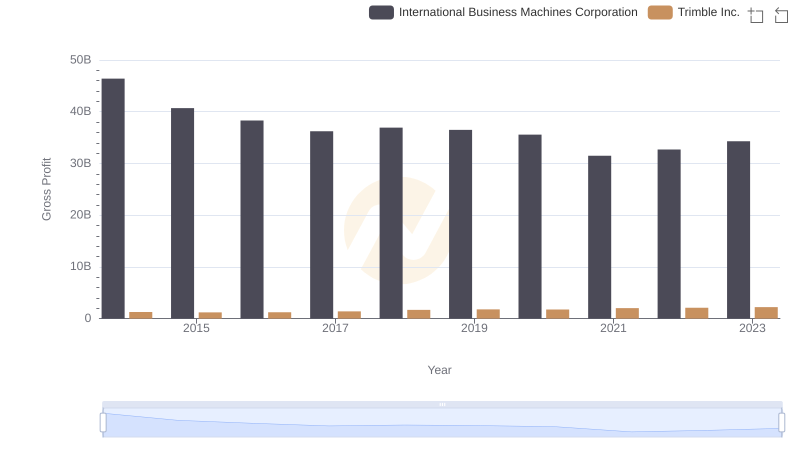
Gross Profit Trends Compared: International Business Machines Corporation vs Trimble Inc.

Who Generates Higher Gross Profit? International Business Machines Corporation or CyberArk Software Ltd.
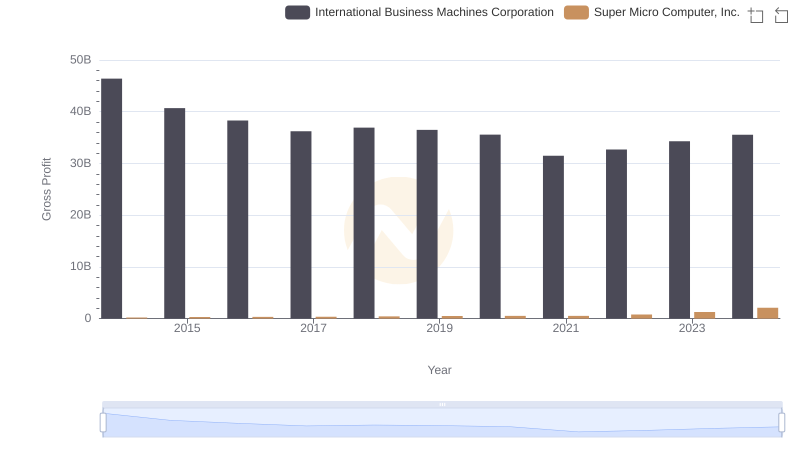
International Business Machines Corporation and Super Micro Computer, Inc.: A Detailed Gross Profit Analysis
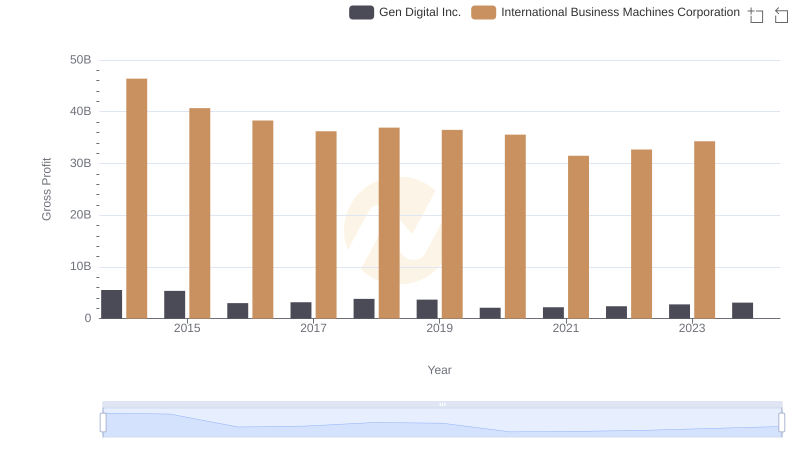
Gross Profit Analysis: Comparing International Business Machines Corporation and Gen Digital Inc.
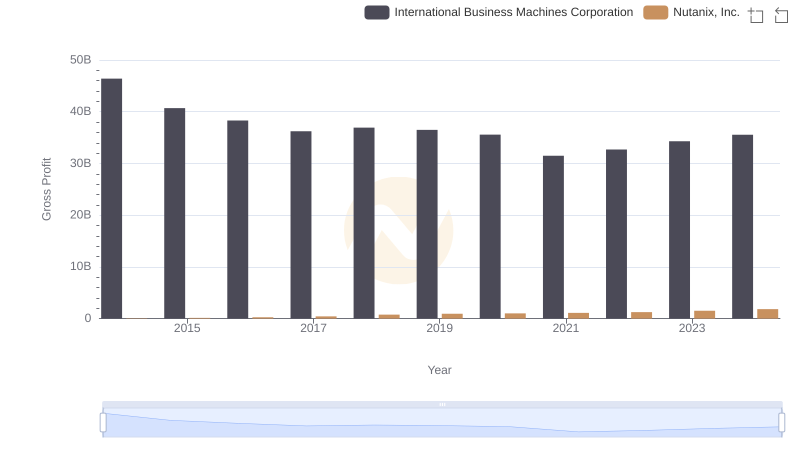
Gross Profit Analysis: Comparing International Business Machines Corporation and Nutanix, Inc.

International Business Machines Corporation and Manhattan Associates, Inc.: A Detailed Gross Profit Analysis
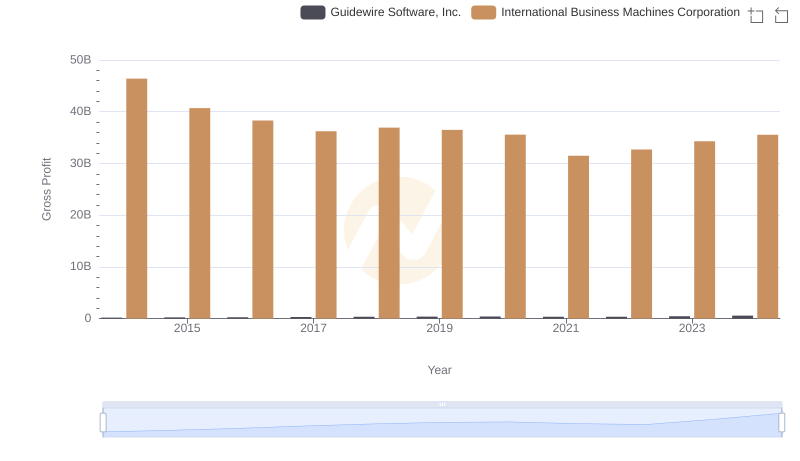
Key Insights on Gross Profit: International Business Machines Corporation vs Guidewire Software, Inc.
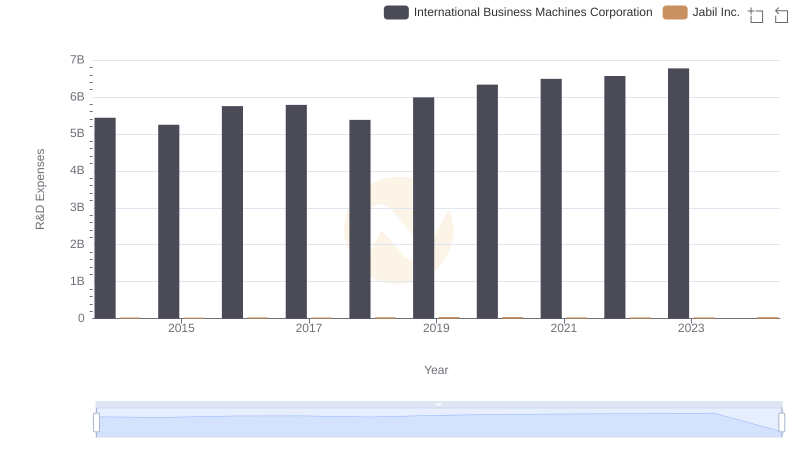
International Business Machines Corporation vs Jabil Inc.: Strategic Focus on R&D Spending
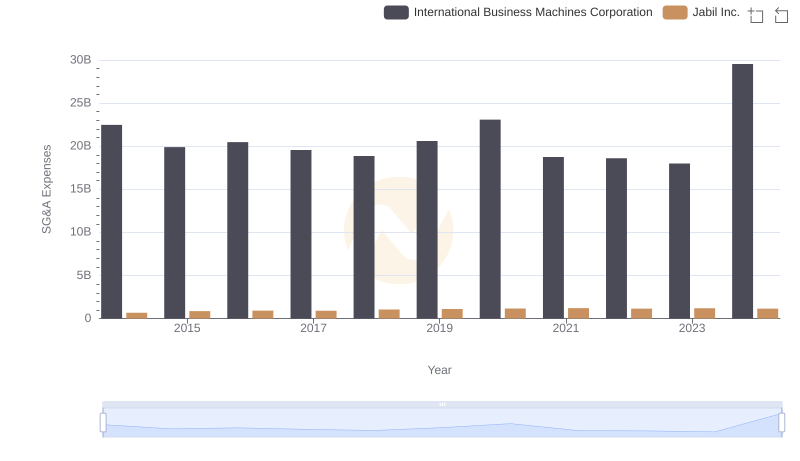
Selling, General, and Administrative Costs: International Business Machines Corporation vs Jabil Inc.
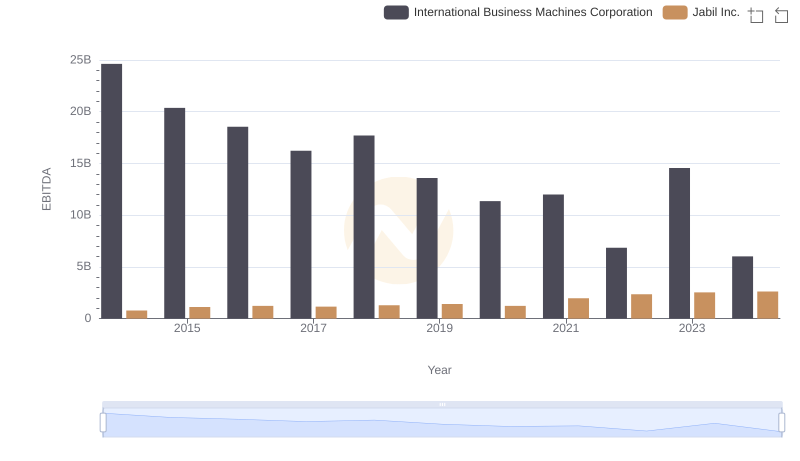
International Business Machines Corporation and Jabil Inc.: A Detailed Examination of EBITDA Performance