| __timestamp | International Business Machines Corporation | Leidos Holdings, Inc. |
|---|---|---|
| Wednesday, January 1, 2014 | 46407000000 | 671000000 |
| Thursday, January 1, 2015 | 40684000000 | 618000000 |
| Friday, January 1, 2016 | 38516000000 | 852000000 |
| Sunday, January 1, 2017 | 36943000000 | 1247000000 |
| Monday, January 1, 2018 | 36936000000 | 1504000000 |
| Tuesday, January 1, 2019 | 31533000000 | 1548000000 |
| Wednesday, January 1, 2020 | 30865000000 | 1737000000 |
| Friday, January 1, 2021 | 31486000000 | 2014000000 |
| Saturday, January 1, 2022 | 32687000000 | 2084000000 |
| Sunday, January 1, 2023 | 34300000000 | 2244000000 |
| Monday, January 1, 2024 | 35551000000 | 2798000000 |
Cracking the code
In the ever-evolving landscape of technology and defense, International Business Machines Corporation (IBM) and Leidos Holdings, Inc. have showcased intriguing financial trajectories over the past decade. From 2014 to 2023, IBM's gross profit has seen a notable decline of approximately 26%, starting from a peak in 2014. This trend reflects the company's strategic shifts and market challenges. Meanwhile, Leidos Holdings has experienced a remarkable growth of over 230% in the same period, highlighting its expanding footprint in the defense and technology sectors. The data for 2024 remains incomplete, but the trends suggest a continued divergence in their financial paths. This analysis provides a compelling snapshot of how these industry giants are navigating their respective markets, offering valuable insights for investors and industry watchers alike.
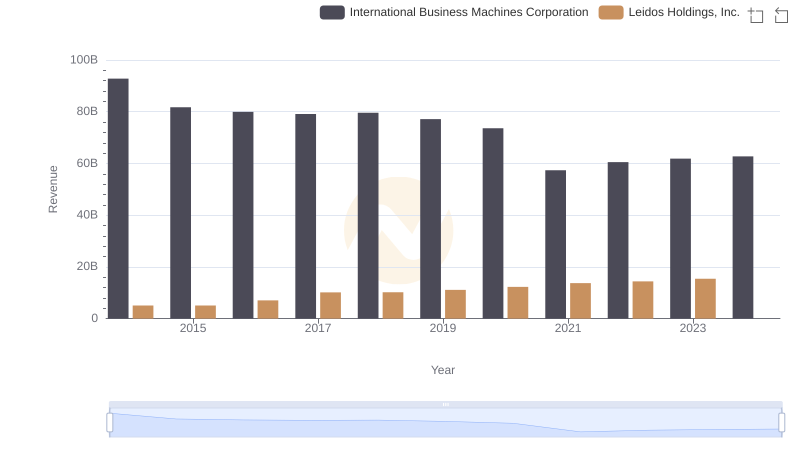
Comparing Revenue Performance: International Business Machines Corporation or Leidos Holdings, Inc.?
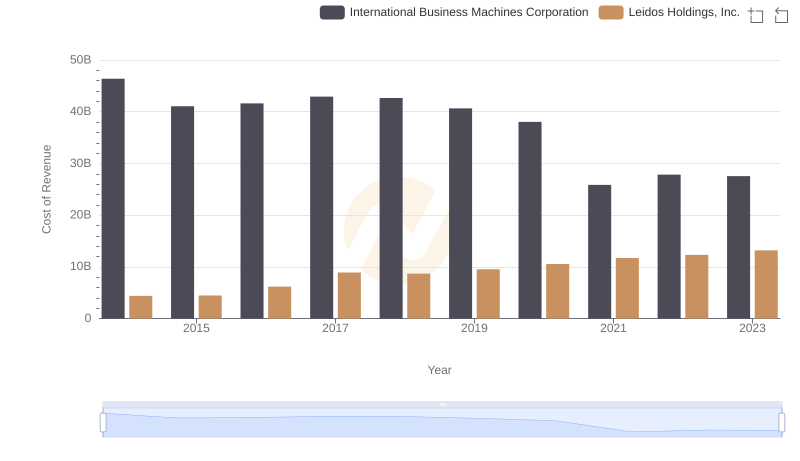
International Business Machines Corporation vs Leidos Holdings, Inc.: Efficiency in Cost of Revenue Explored
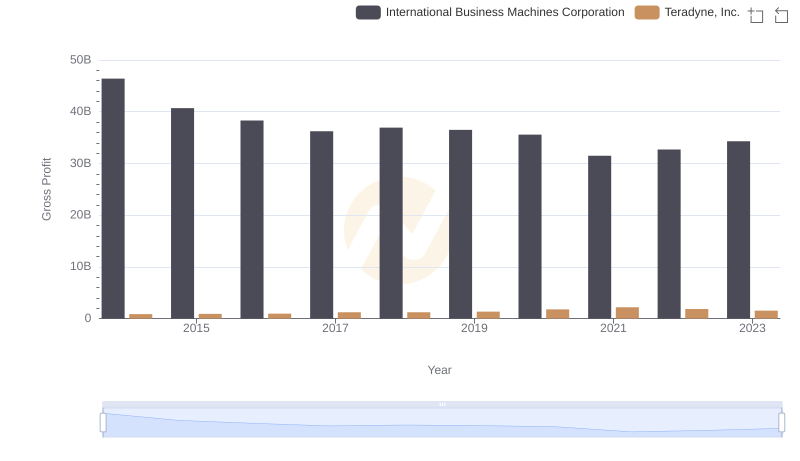
Key Insights on Gross Profit: International Business Machines Corporation vs Teradyne, Inc.

Gross Profit Trends Compared: International Business Machines Corporation vs Trimble Inc.

Who Generates Higher Gross Profit? International Business Machines Corporation or CyberArk Software Ltd.
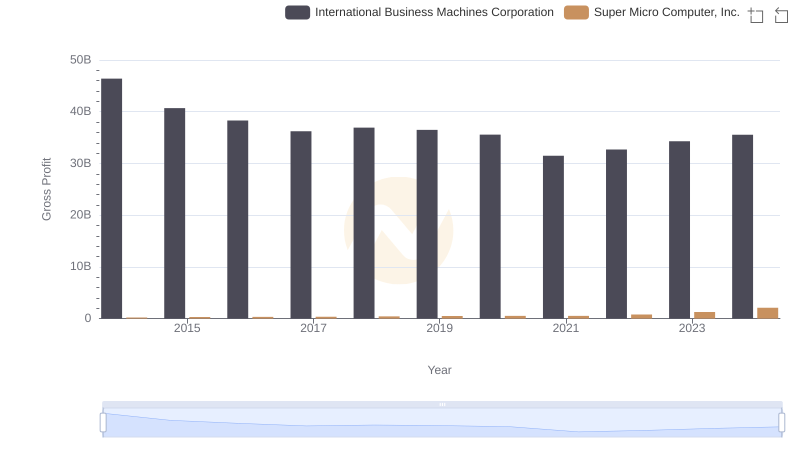
International Business Machines Corporation and Super Micro Computer, Inc.: A Detailed Gross Profit Analysis
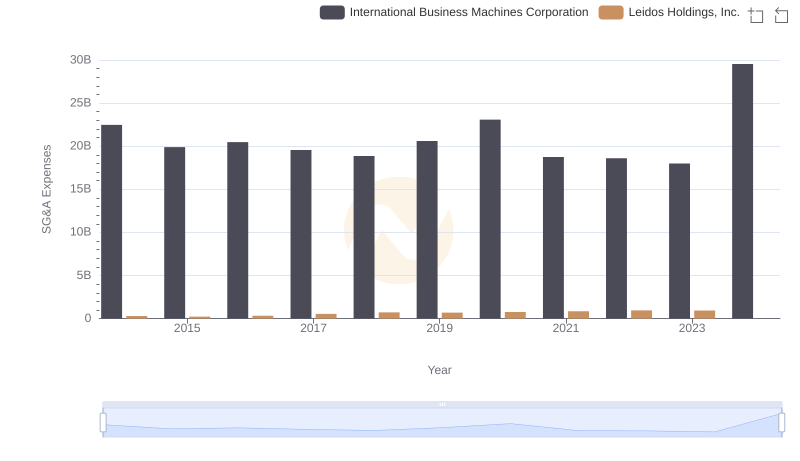
Who Optimizes SG&A Costs Better? International Business Machines Corporation or Leidos Holdings, Inc.
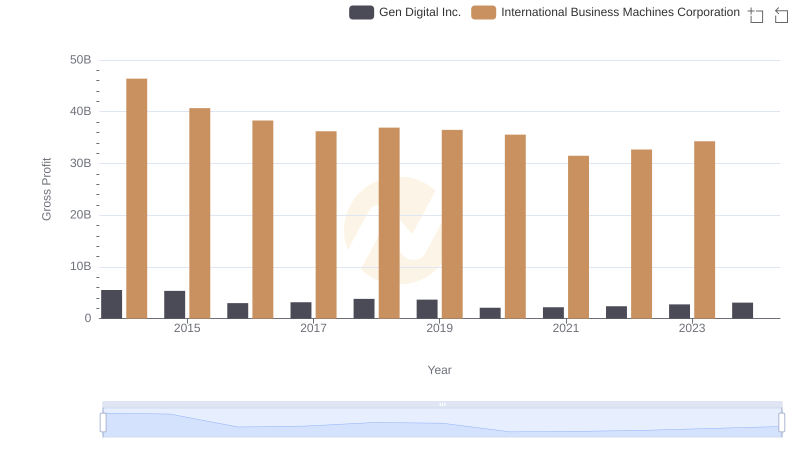
Gross Profit Analysis: Comparing International Business Machines Corporation and Gen Digital Inc.

Gross Profit Analysis: Comparing International Business Machines Corporation and Nutanix, Inc.
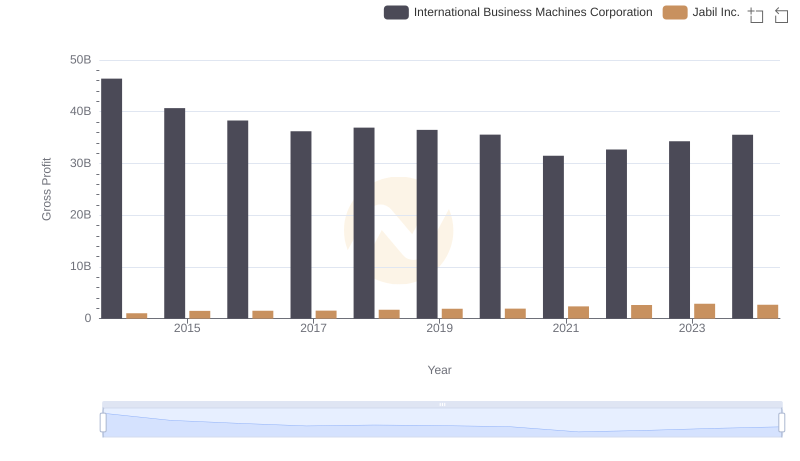
International Business Machines Corporation and Jabil Inc.: A Detailed Gross Profit Analysis

International Business Machines Corporation and Manhattan Associates, Inc.: A Detailed Gross Profit Analysis
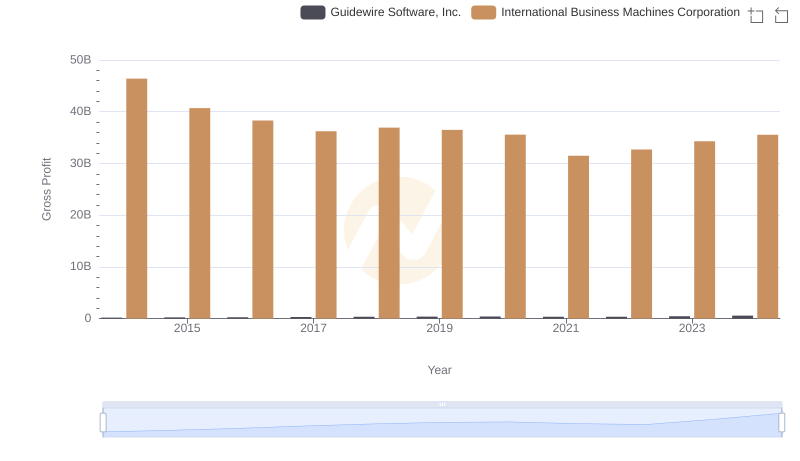
Key Insights on Gross Profit: International Business Machines Corporation vs Guidewire Software, Inc.