| __timestamp | International Business Machines Corporation | Nutanix, Inc. |
|---|---|---|
| Wednesday, January 1, 2014 | 46407000000 | 66215000 |
| Thursday, January 1, 2015 | 40684000000 | 140473000 |
| Friday, January 1, 2016 | 38516000000 | 274141000 |
| Sunday, January 1, 2017 | 36943000000 | 439538000 |
| Monday, January 1, 2018 | 36936000000 | 769427000 |
| Tuesday, January 1, 2019 | 31533000000 | 932015000 |
| Wednesday, January 1, 2020 | 30865000000 | 1020993000 |
| Friday, January 1, 2021 | 31486000000 | 1102458000 |
| Saturday, January 1, 2022 | 32687000000 | 1259640000 |
| Sunday, January 1, 2023 | 34300000000 | 1530708000 |
| Monday, January 1, 2024 | 35551000000 | 1824704000 |
Igniting the spark of knowledge
In the ever-evolving tech industry, understanding financial health is crucial. This analysis compares the gross profit trends of two significant players: International Business Machines Corporation (IBM) and Nutanix, Inc., from 2014 to 2024. Over this decade, IBM's gross profit has seen a decline of approximately 24%, from a peak in 2014 to a low in 2021, before showing signs of recovery. In contrast, Nutanix, a newer entrant, has demonstrated impressive growth, with its gross profit increasing nearly 27 times over the same period. This stark contrast highlights the challenges established companies face in maintaining growth, while newer firms capitalize on innovation and market shifts. As we move into 2024, IBM's gross profit is rebounding, suggesting strategic adjustments, while Nutanix continues its upward trajectory, reflecting its agile business model and market adaptability.
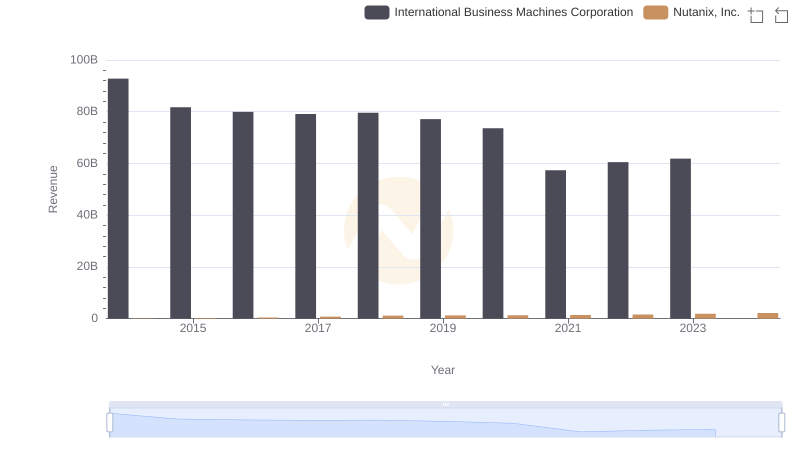
Comparing Revenue Performance: International Business Machines Corporation or Nutanix, Inc.?
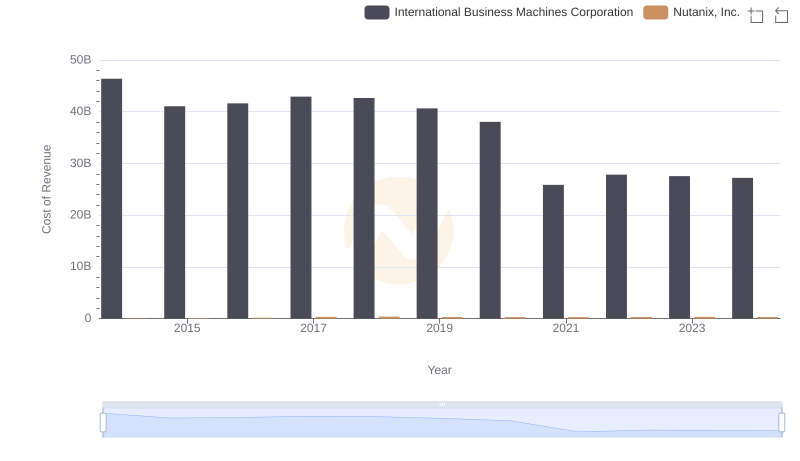
Analyzing Cost of Revenue: International Business Machines Corporation and Nutanix, Inc.
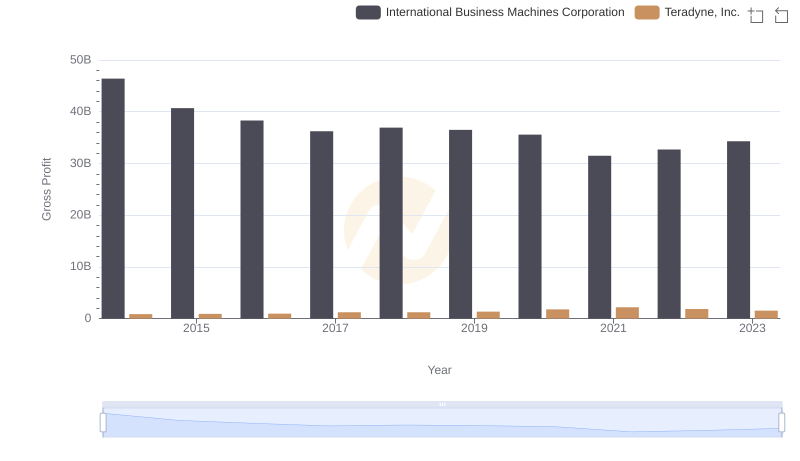
Key Insights on Gross Profit: International Business Machines Corporation vs Teradyne, Inc.

Gross Profit Trends Compared: International Business Machines Corporation vs Trimble Inc.

Who Generates Higher Gross Profit? International Business Machines Corporation or CyberArk Software Ltd.
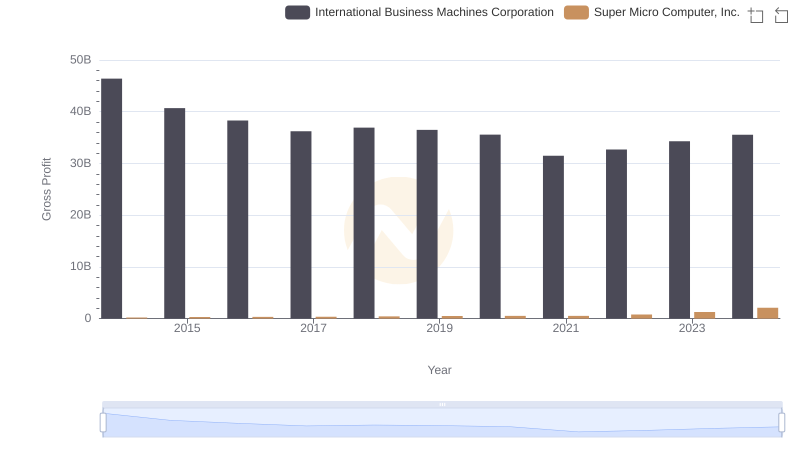
International Business Machines Corporation and Super Micro Computer, Inc.: A Detailed Gross Profit Analysis
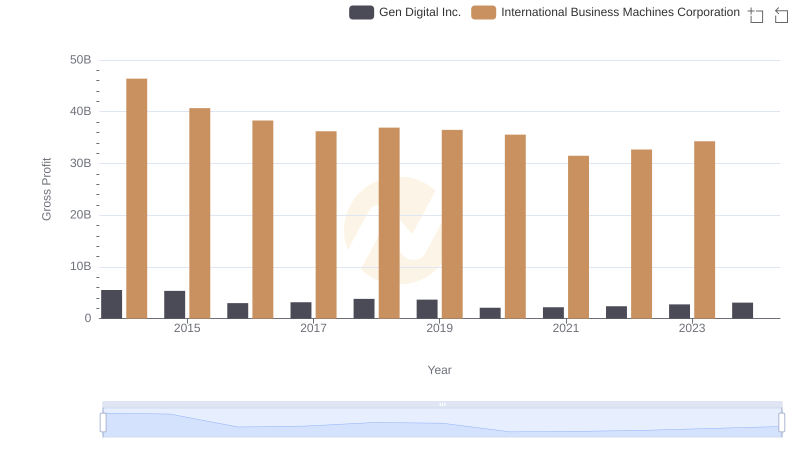
Gross Profit Analysis: Comparing International Business Machines Corporation and Gen Digital Inc.
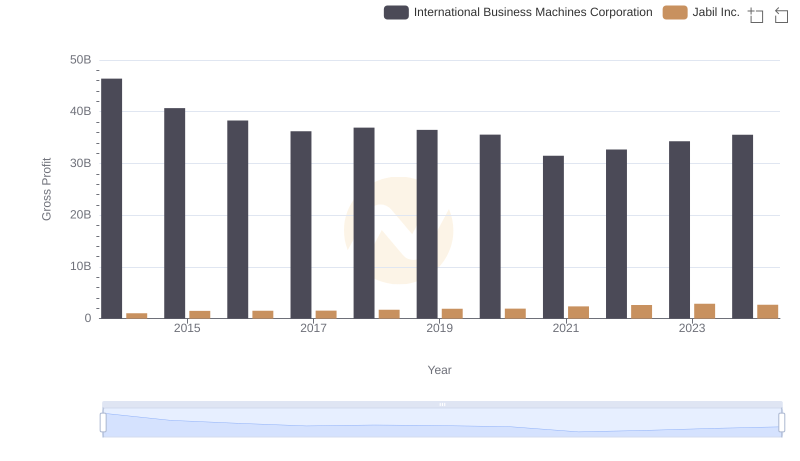
International Business Machines Corporation and Jabil Inc.: A Detailed Gross Profit Analysis

International Business Machines Corporation and Manhattan Associates, Inc.: A Detailed Gross Profit Analysis
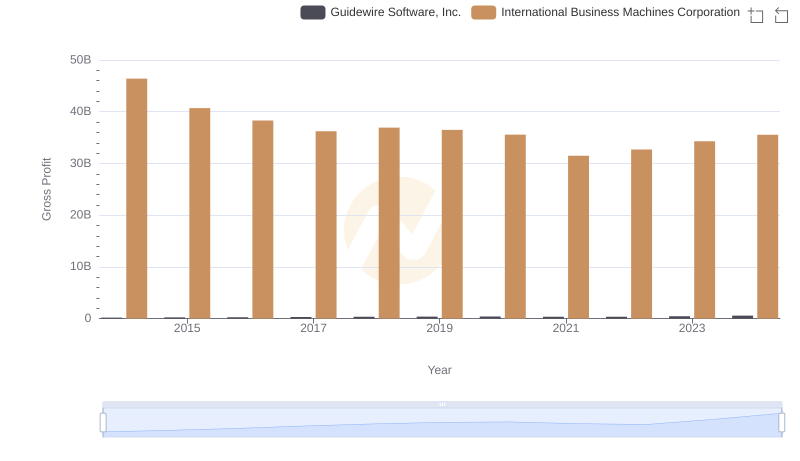
Key Insights on Gross Profit: International Business Machines Corporation vs Guidewire Software, Inc.
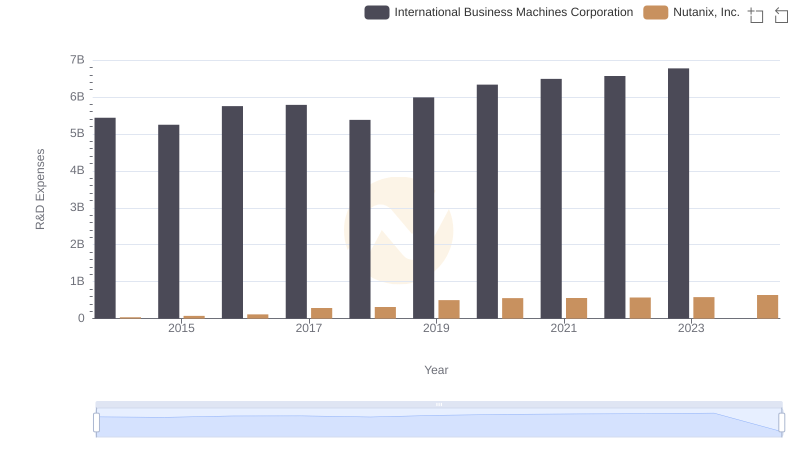
R&D Spending Showdown: International Business Machines Corporation vs Nutanix, Inc.
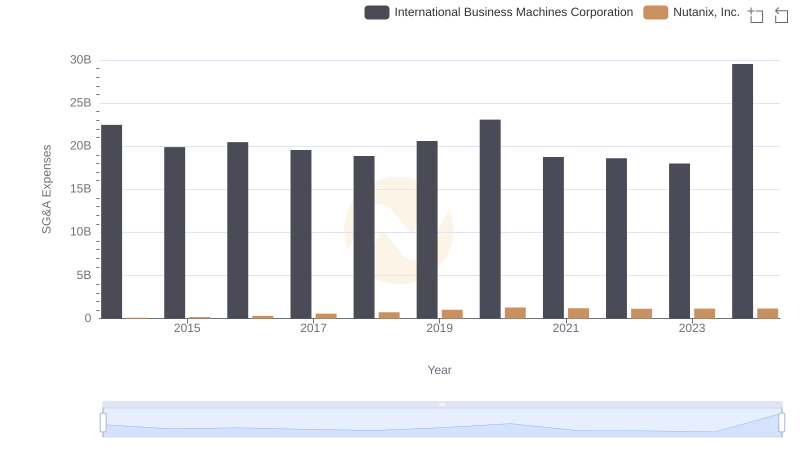
International Business Machines Corporation and Nutanix, Inc.: SG&A Spending Patterns Compared