| __timestamp | ITT Inc. | Ingersoll Rand Inc. |
|---|---|---|
| Wednesday, January 1, 2014 | 2654600000 | 2570005000 |
| Thursday, January 1, 2015 | 2485600000 | 2126900000 |
| Friday, January 1, 2016 | 2405400000 | 1939436000 |
| Sunday, January 1, 2017 | 2585300000 | 2375400000 |
| Monday, January 1, 2018 | 2745100000 | 2689800000 |
| Tuesday, January 1, 2019 | 2846400000 | 2451900000 |
| Wednesday, January 1, 2020 | 2477800000 | 4910200000 |
| Friday, January 1, 2021 | 2765000000 | 5152400000 |
| Saturday, January 1, 2022 | 2987700000 | 5916300000 |
| Sunday, January 1, 2023 | 3283000000 | 6876100000 |
| Monday, January 1, 2024 | 3630700000 | 0 |
Infusing magic into the data realm
In the competitive landscape of industrial manufacturing, Ingersoll Rand Inc. and ITT Inc. have been vying for the top spot in yearly revenue. Over the past decade, these two giants have shown remarkable growth, but who truly leads the pack?
From 2014 to 2023, ITT Inc. maintained a steady revenue growth, peaking at a 23% increase by 2023. However, Ingersoll Rand Inc. surged ahead with a staggering 168% growth in the same period, showcasing its dominance in the industry. Notably, Ingersoll Rand's revenue leap in 2020 marked a pivotal moment, doubling its figures from the previous year.
This data not only highlights the resilience and strategic prowess of Ingersoll Rand but also underscores the dynamic nature of the industrial sector. As these companies continue to innovate, the race for revenue leadership remains as thrilling as ever.
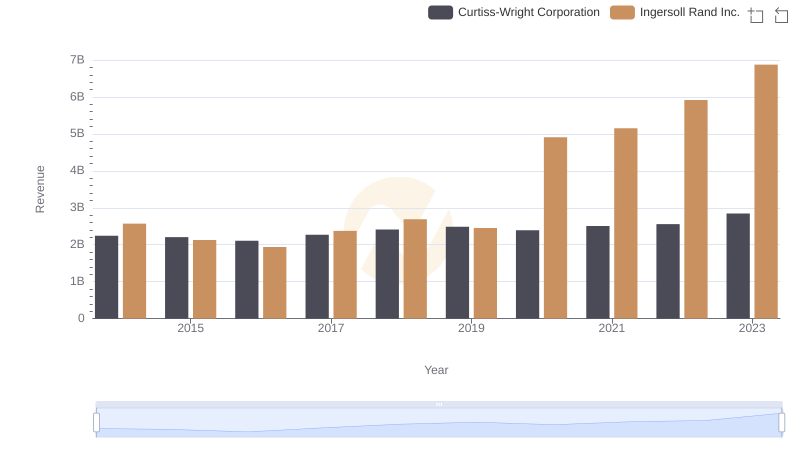
Ingersoll Rand Inc. or Curtiss-Wright Corporation: Who Leads in Yearly Revenue?
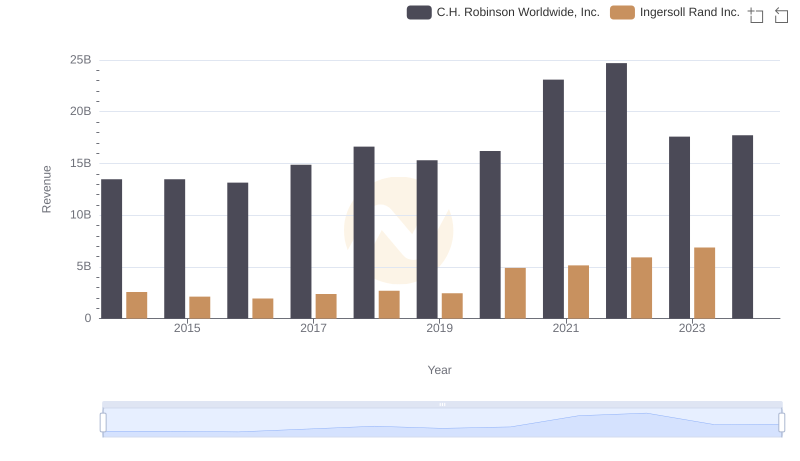
Comparing Revenue Performance: Ingersoll Rand Inc. or C.H. Robinson Worldwide, Inc.?
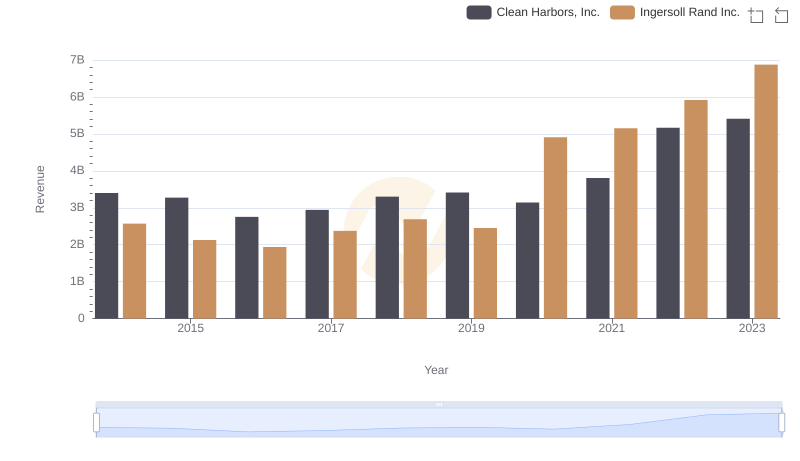
Comparing Revenue Performance: Ingersoll Rand Inc. or Clean Harbors, Inc.?
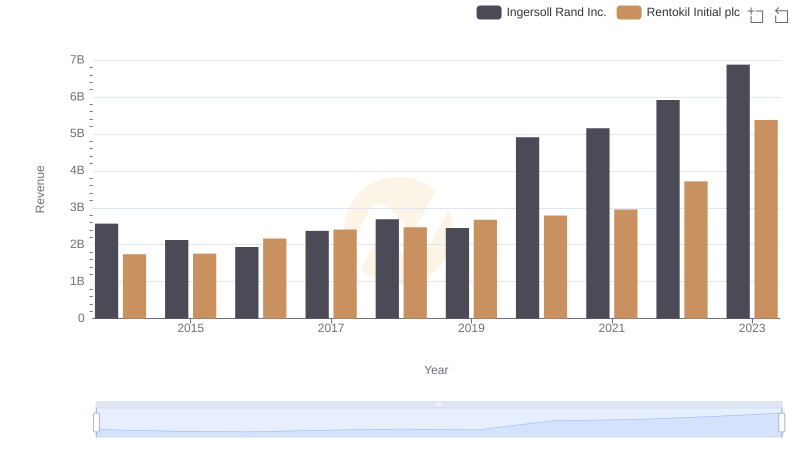
Comparing Revenue Performance: Ingersoll Rand Inc. or Rentokil Initial plc?

Who Generates More Revenue? Ingersoll Rand Inc. or TFI International Inc.
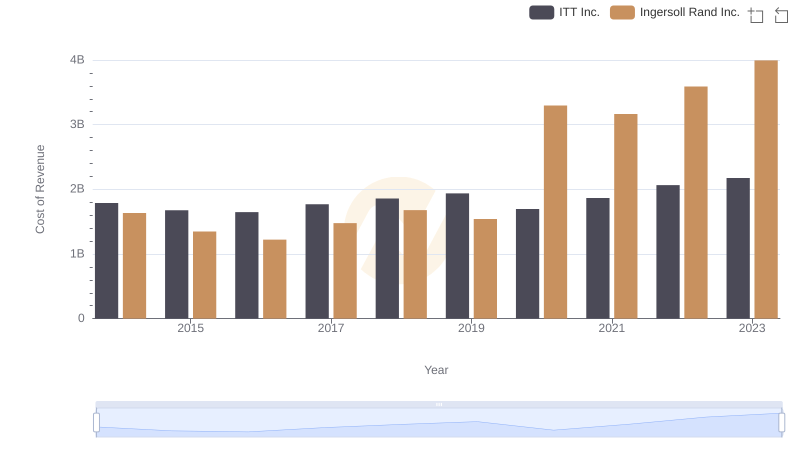
Ingersoll Rand Inc. vs ITT Inc.: Efficiency in Cost of Revenue Explored
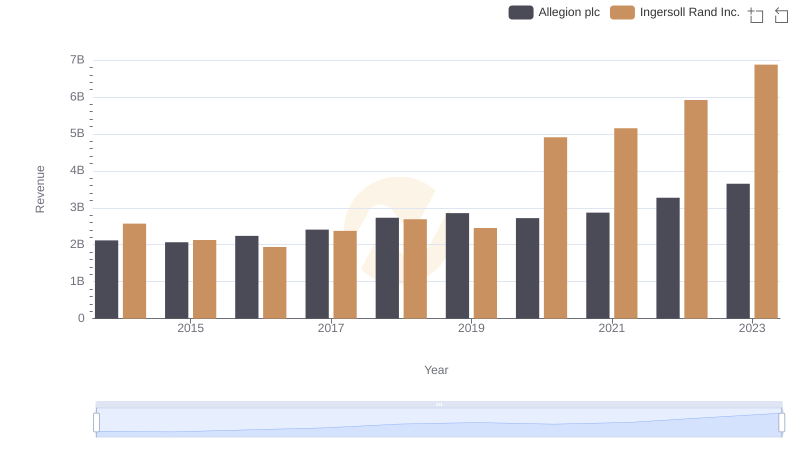
Annual Revenue Comparison: Ingersoll Rand Inc. vs Allegion plc
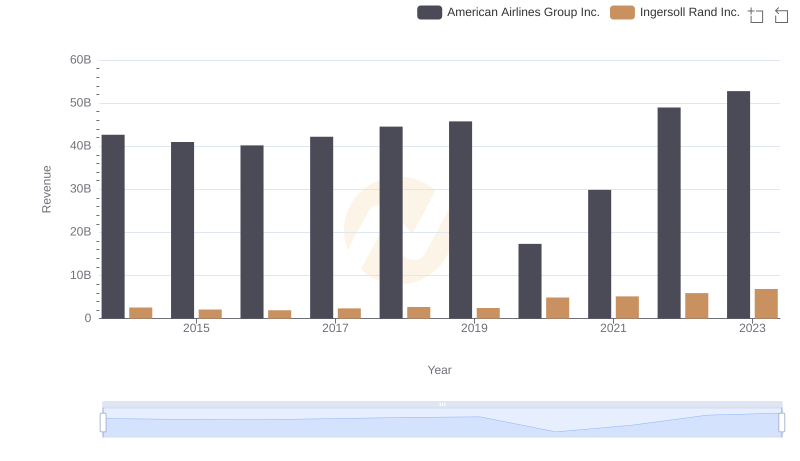
Comparing Revenue Performance: Ingersoll Rand Inc. or American Airlines Group Inc.?
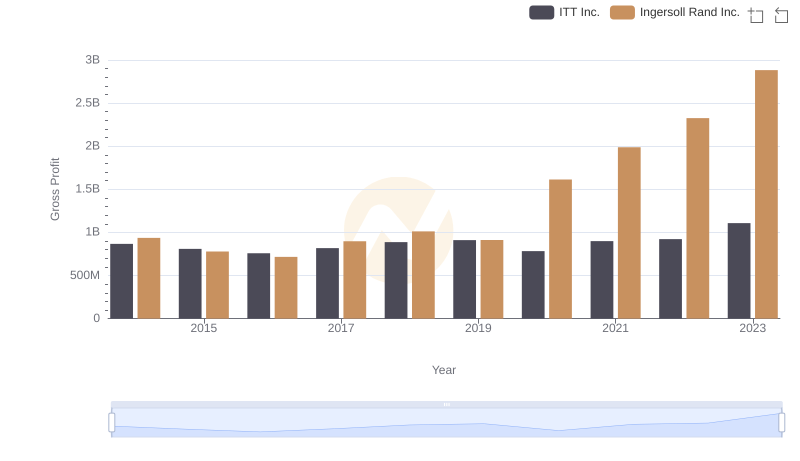
Gross Profit Comparison: Ingersoll Rand Inc. and ITT Inc. Trends
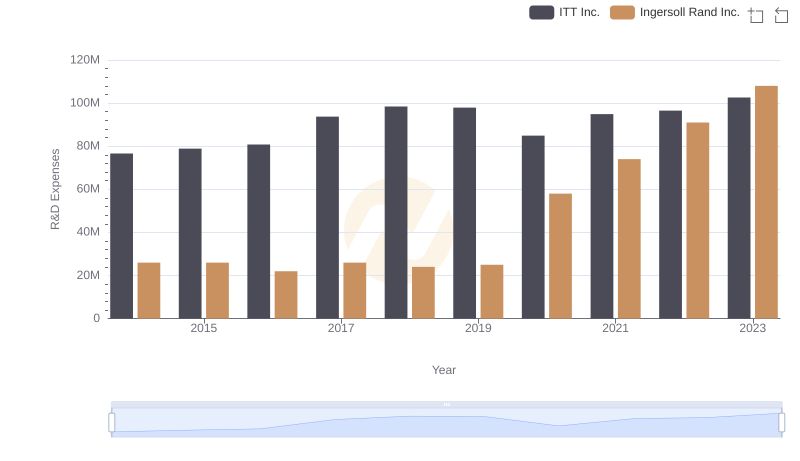
Comparing Innovation Spending: Ingersoll Rand Inc. and ITT Inc.