| __timestamp | ITT Inc. | Ingersoll Rand Inc. |
|---|---|---|
| Wednesday, January 1, 2014 | 866400000 | 936781000 |
| Thursday, January 1, 2015 | 809100000 | 779100000 |
| Friday, January 1, 2016 | 758200000 | 716731000 |
| Sunday, January 1, 2017 | 817200000 | 897900000 |
| Monday, January 1, 2018 | 887200000 | 1012500000 |
| Tuesday, January 1, 2019 | 910100000 | 911700000 |
| Wednesday, January 1, 2020 | 782200000 | 1613400000 |
| Friday, January 1, 2021 | 899500000 | 1988500000 |
| Saturday, January 1, 2022 | 922300000 | 2325600000 |
| Sunday, January 1, 2023 | 1107300000 | 2882200000 |
| Monday, January 1, 2024 | 1247300000 | 0 |
Unveiling the hidden dimensions of data
In the ever-evolving landscape of industrial manufacturing, two giants, Ingersoll Rand Inc. and ITT Inc., have showcased intriguing financial trajectories over the past decade. From 2014 to 2023, Ingersoll Rand Inc. has demonstrated a remarkable growth in gross profit, surging by approximately 207%, from around $937 million to nearly $2.88 billion. This growth reflects the company's strategic expansions and market adaptability.
Conversely, ITT Inc. has experienced a steadier climb, with a 28% increase in gross profit, rising from $866 million to $1.11 billion. This consistent growth underscores ITT's resilience and operational efficiency in a competitive market.
The data highlights a pivotal shift in 2020, where Ingersoll Rand's gross profit nearly doubled, marking a significant turning point. As these companies continue to innovate, their financial performances offer valuable insights into the industrial sector's future dynamics.
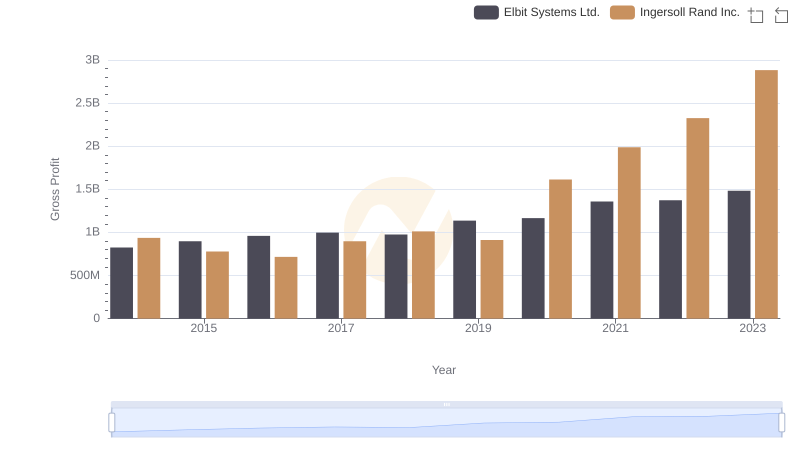
Gross Profit Analysis: Comparing Ingersoll Rand Inc. and Elbit Systems Ltd.
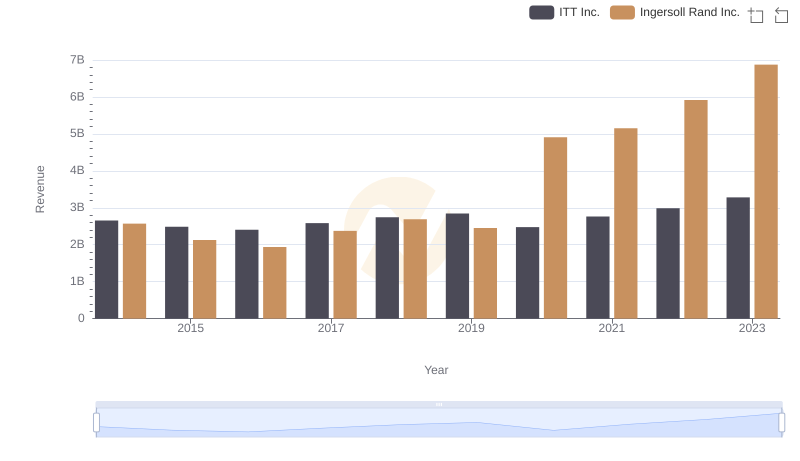
Ingersoll Rand Inc. or ITT Inc.: Who Leads in Yearly Revenue?
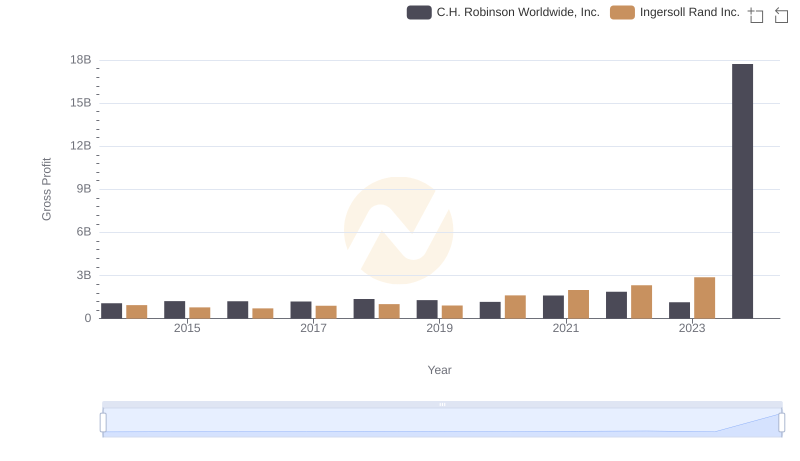
Ingersoll Rand Inc. and C.H. Robinson Worldwide, Inc.: A Detailed Gross Profit Analysis
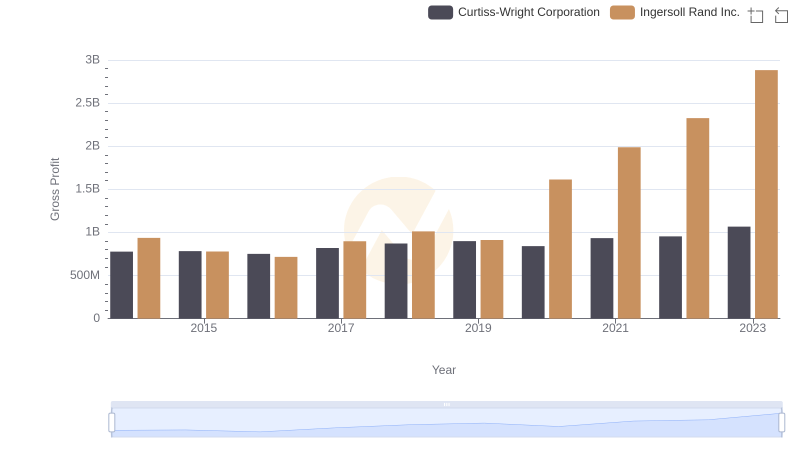
Who Generates Higher Gross Profit? Ingersoll Rand Inc. or Curtiss-Wright Corporation
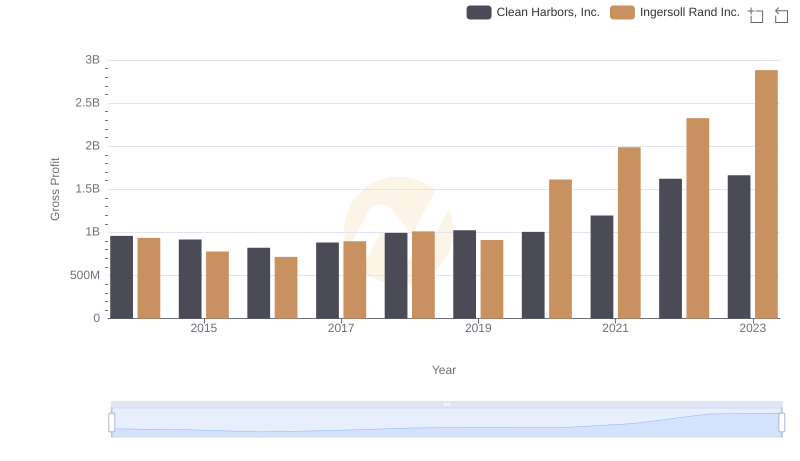
Who Generates Higher Gross Profit? Ingersoll Rand Inc. or Clean Harbors, Inc.
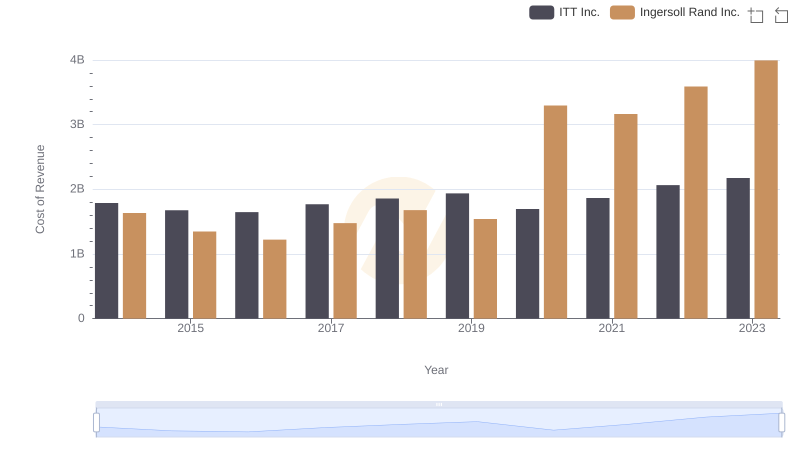
Ingersoll Rand Inc. vs ITT Inc.: Efficiency in Cost of Revenue Explored
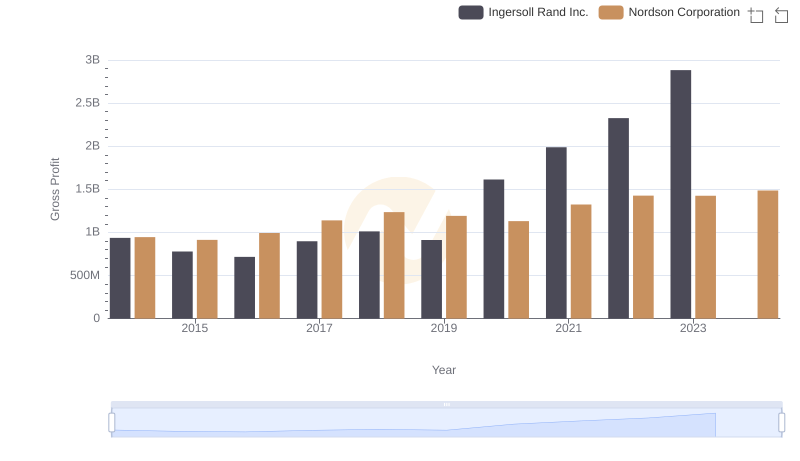
Ingersoll Rand Inc. vs Nordson Corporation: A Gross Profit Performance Breakdown
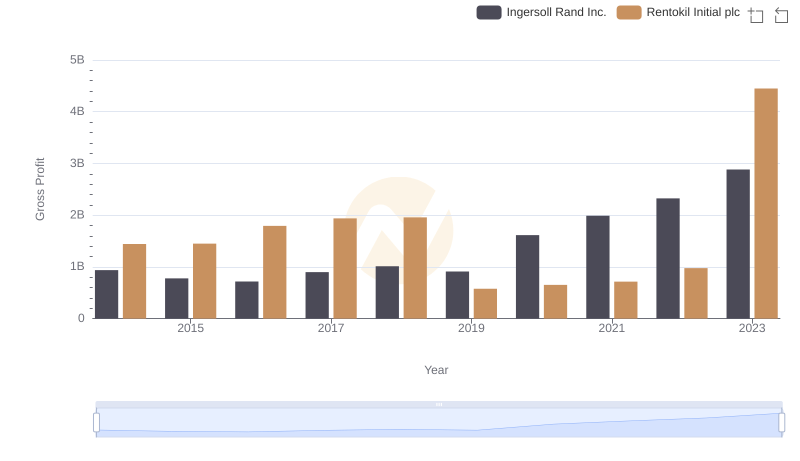
Gross Profit Comparison: Ingersoll Rand Inc. and Rentokil Initial plc Trends
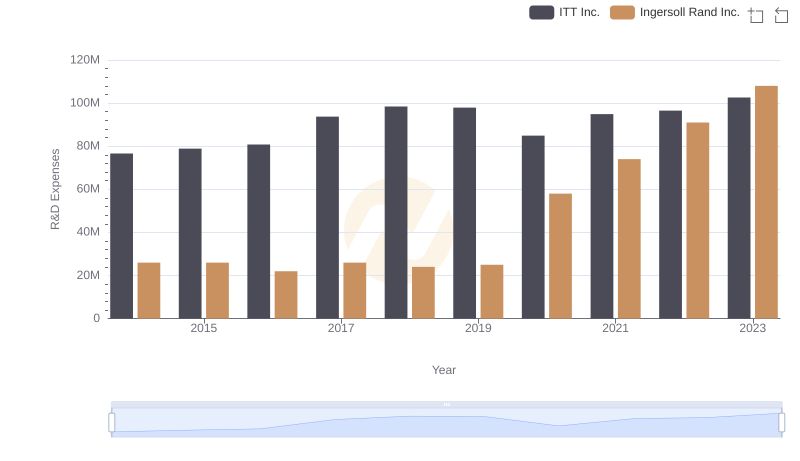
Comparing Innovation Spending: Ingersoll Rand Inc. and ITT Inc.