| __timestamp | Allegion plc | Ingersoll Rand Inc. |
|---|---|---|
| Wednesday, January 1, 2014 | 2118300000 | 2570005000 |
| Thursday, January 1, 2015 | 2068100000 | 2126900000 |
| Friday, January 1, 2016 | 2238000000 | 1939436000 |
| Sunday, January 1, 2017 | 2408200000 | 2375400000 |
| Monday, January 1, 2018 | 2731700000 | 2689800000 |
| Tuesday, January 1, 2019 | 2854000000 | 2451900000 |
| Wednesday, January 1, 2020 | 2719900000 | 4910200000 |
| Friday, January 1, 2021 | 2867400000 | 5152400000 |
| Saturday, January 1, 2022 | 3271900000 | 5916300000 |
| Sunday, January 1, 2023 | 3650800000 | 6876100000 |
| Monday, January 1, 2024 | 3772200000 | 0 |
Cracking the code
In the competitive landscape of industrial and security solutions, Ingersoll Rand Inc. and Allegion plc have showcased remarkable revenue trajectories over the past decade. From 2014 to 2023, Ingersoll Rand Inc. has seen its revenue soar by approximately 167%, reaching a peak in 2023. This growth reflects the company's strategic expansions and innovations in the industrial sector. Meanwhile, Allegion plc, a leader in security products, has experienced a steady revenue increase of about 72% during the same period, highlighting its resilience and adaptability in a dynamic market.
These trends underscore the evolving demands and opportunities within their respective industries, offering valuable insights for investors and market analysts.
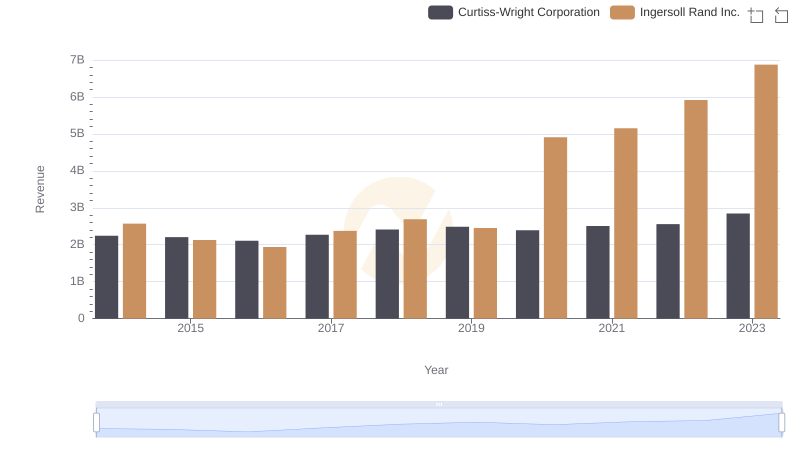
Ingersoll Rand Inc. or Curtiss-Wright Corporation: Who Leads in Yearly Revenue?
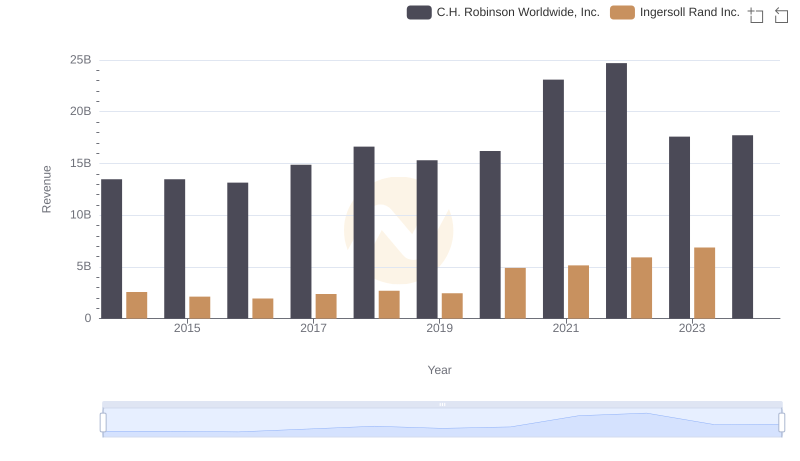
Comparing Revenue Performance: Ingersoll Rand Inc. or C.H. Robinson Worldwide, Inc.?
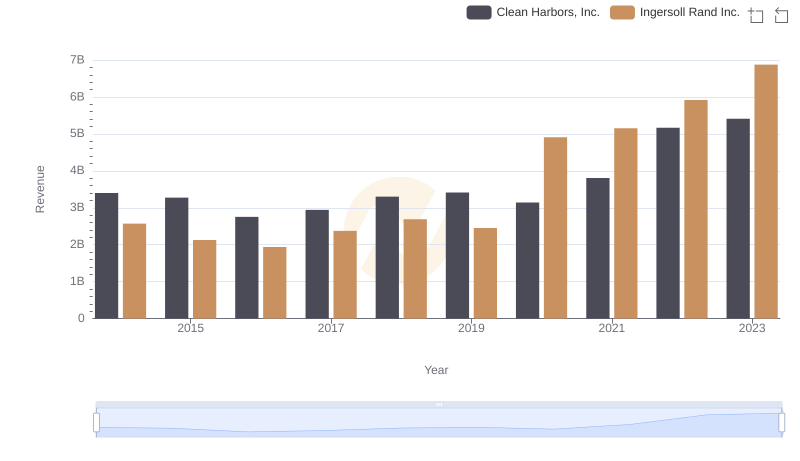
Comparing Revenue Performance: Ingersoll Rand Inc. or Clean Harbors, Inc.?
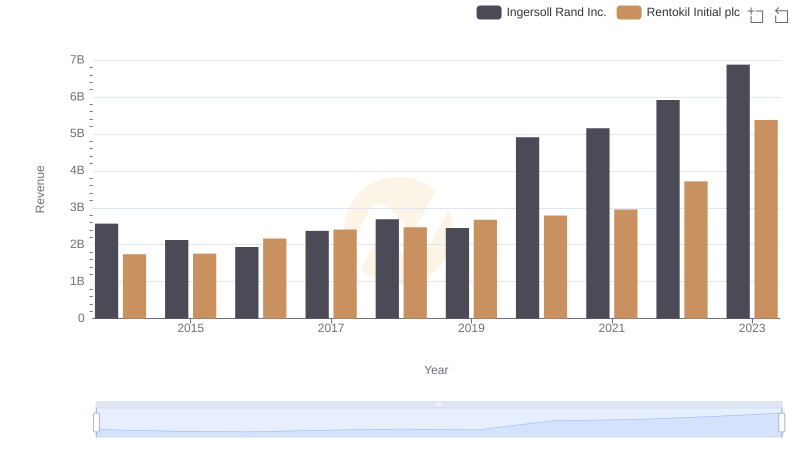
Comparing Revenue Performance: Ingersoll Rand Inc. or Rentokil Initial plc?
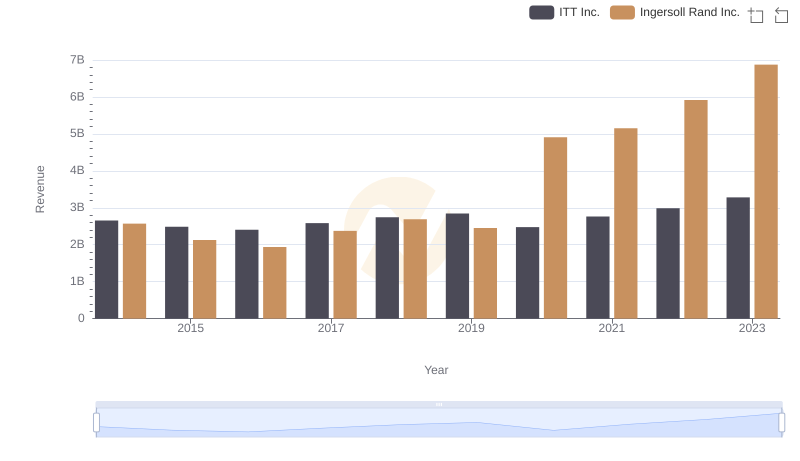
Ingersoll Rand Inc. or ITT Inc.: Who Leads in Yearly Revenue?

Who Generates More Revenue? Ingersoll Rand Inc. or TFI International Inc.
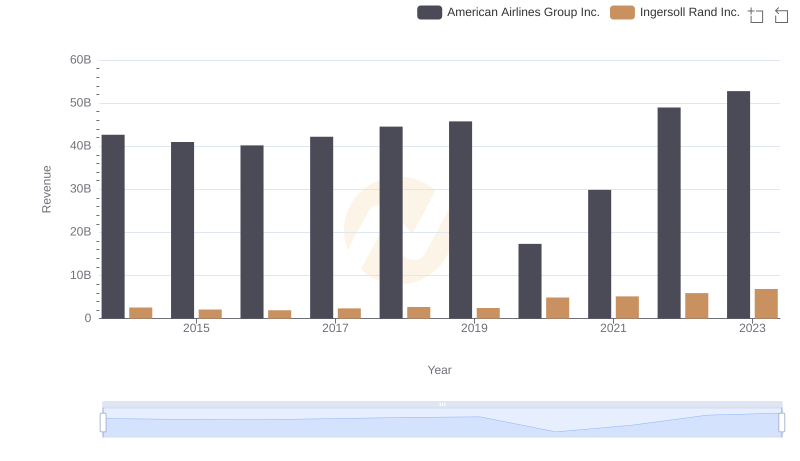
Comparing Revenue Performance: Ingersoll Rand Inc. or American Airlines Group Inc.?