| __timestamp | American Airlines Group Inc. | Ingersoll Rand Inc. |
|---|---|---|
| Wednesday, January 1, 2014 | 42650000000 | 2570005000 |
| Thursday, January 1, 2015 | 40990000000 | 2126900000 |
| Friday, January 1, 2016 | 40180000000 | 1939436000 |
| Sunday, January 1, 2017 | 42207000000 | 2375400000 |
| Monday, January 1, 2018 | 44541000000 | 2689800000 |
| Tuesday, January 1, 2019 | 45768000000 | 2451900000 |
| Wednesday, January 1, 2020 | 17337000000 | 4910200000 |
| Friday, January 1, 2021 | 29882000000 | 5152400000 |
| Saturday, January 1, 2022 | 48971000000 | 5916300000 |
| Sunday, January 1, 2023 | 52788000000 | 6876100000 |
| Monday, January 1, 2024 | 0 |
Data in motion
In the ever-evolving landscape of American industry, two titans stand out: Ingersoll Rand Inc., a leader in industrial solutions, and American Airlines Group Inc., a cornerstone of global aviation. Over the past decade, these companies have navigated economic turbulence with varying degrees of success.
From 2014 to 2023, American Airlines' revenue soared by approximately 24%, peaking in 2023. Despite a significant dip in 2020, likely due to the pandemic, the airline rebounded strongly. In contrast, Ingersoll Rand's revenue grew by about 167% over the same period, showcasing a steady upward trajectory.
While American Airlines' revenue is nearly ten times that of Ingersoll Rand, the latter's consistent growth highlights its resilience and adaptability. This comparison underscores the diverse challenges and opportunities faced by different sectors in the U.S. economy.
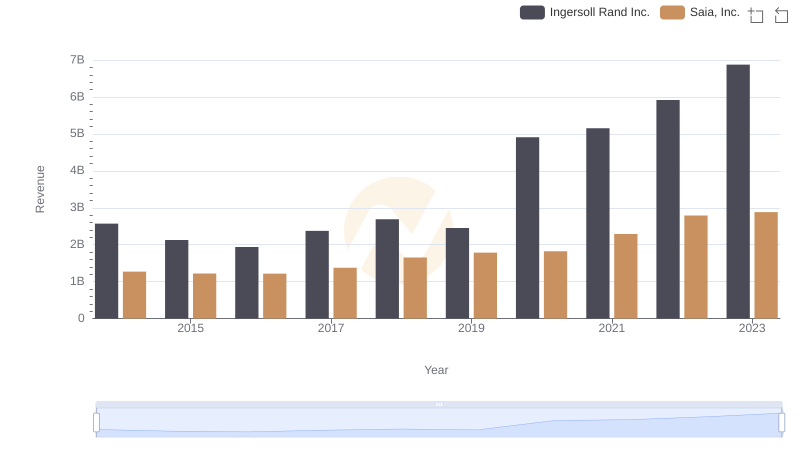
Ingersoll Rand Inc. and Saia, Inc.: A Comprehensive Revenue Analysis
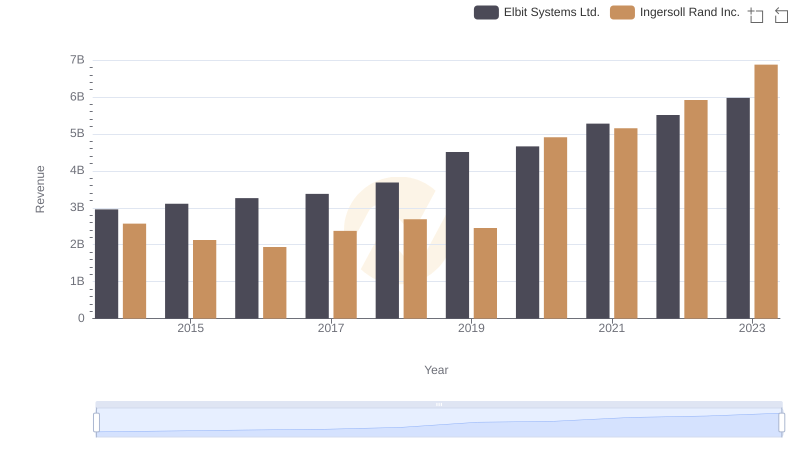
Comparing Revenue Performance: Ingersoll Rand Inc. or Elbit Systems Ltd.?
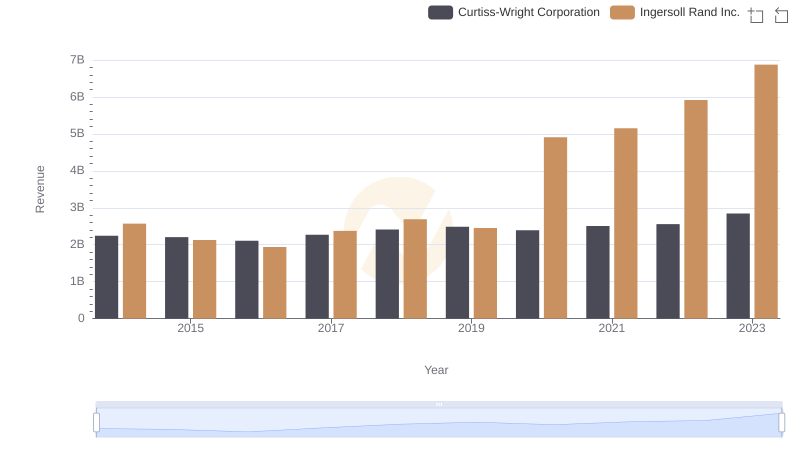
Ingersoll Rand Inc. or Curtiss-Wright Corporation: Who Leads in Yearly Revenue?
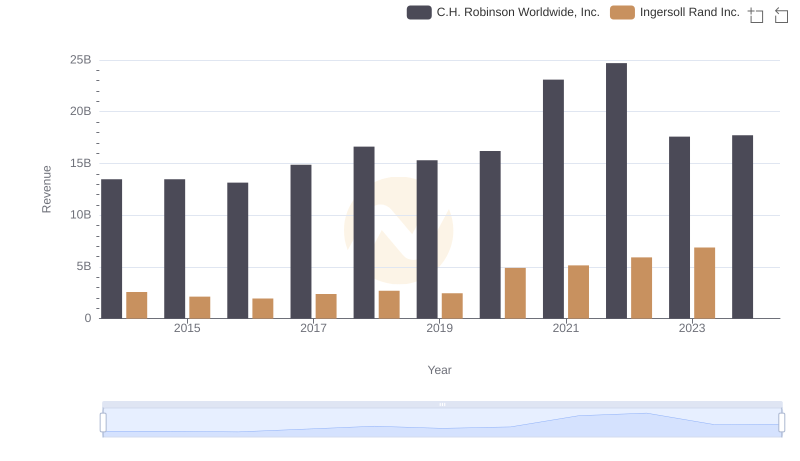
Comparing Revenue Performance: Ingersoll Rand Inc. or C.H. Robinson Worldwide, Inc.?
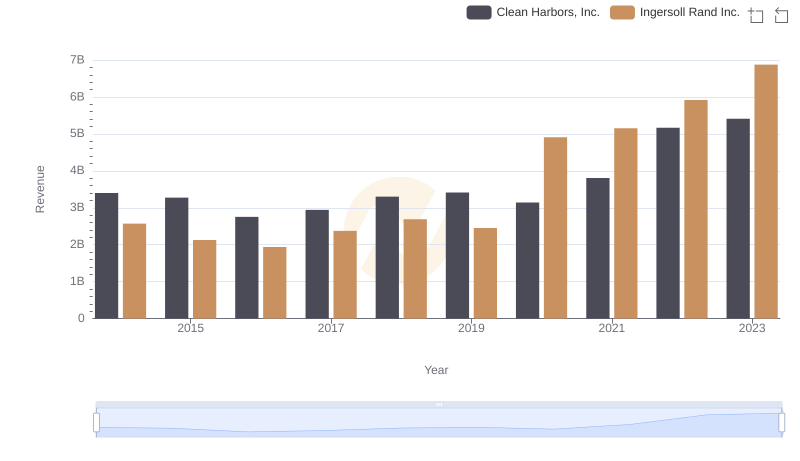
Comparing Revenue Performance: Ingersoll Rand Inc. or Clean Harbors, Inc.?
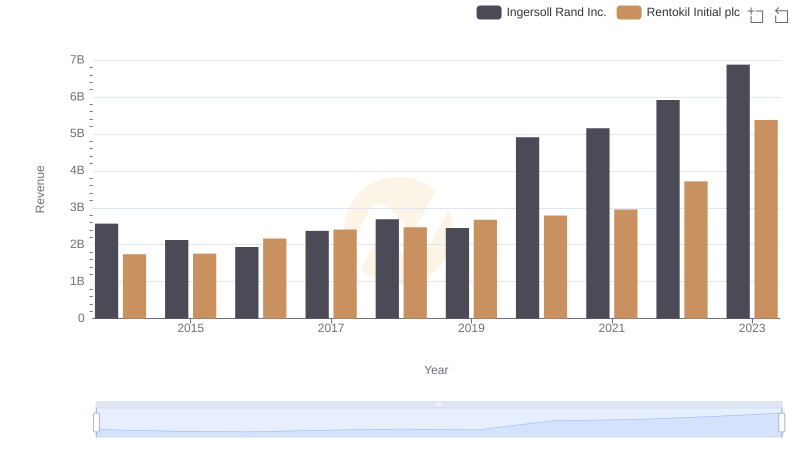
Comparing Revenue Performance: Ingersoll Rand Inc. or Rentokil Initial plc?
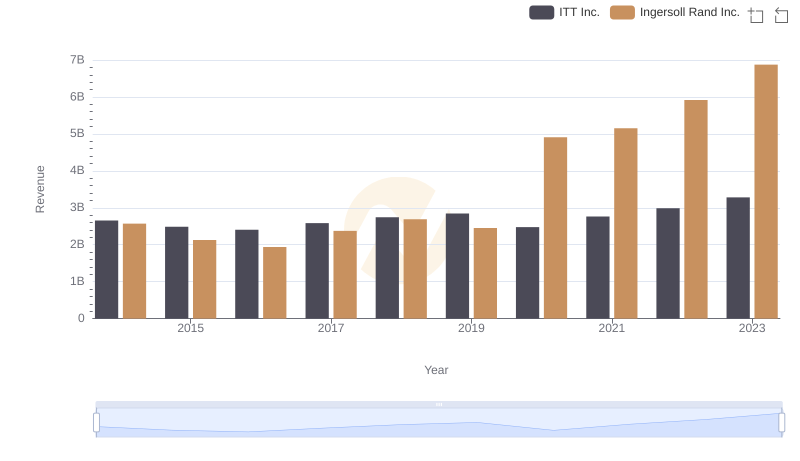
Ingersoll Rand Inc. or ITT Inc.: Who Leads in Yearly Revenue?

Who Generates More Revenue? Ingersoll Rand Inc. or TFI International Inc.
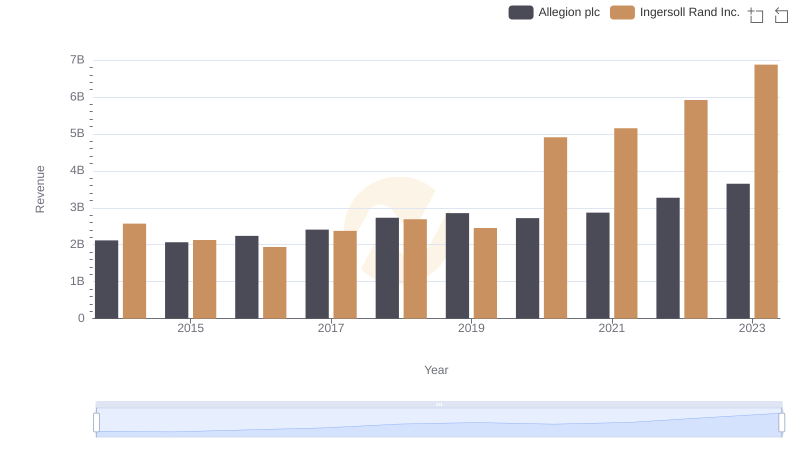
Annual Revenue Comparison: Ingersoll Rand Inc. vs Allegion plc
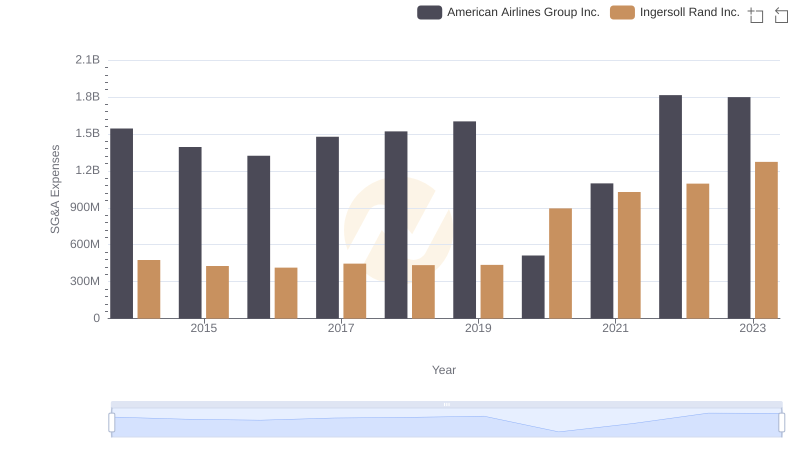
Cost Management Insights: SG&A Expenses for Ingersoll Rand Inc. and American Airlines Group Inc.