| __timestamp | CGI Inc. | Infosys Limited |
|---|---|---|
| Wednesday, January 1, 2014 | 8263306000 | 5374000000 |
| Thursday, January 1, 2015 | 7980185000 | 5950000000 |
| Friday, January 1, 2016 | 8293407000 | 6446000000 |
| Sunday, January 1, 2017 | 8500825000 | 7001000000 |
| Monday, January 1, 2018 | 9045660000 | 7687000000 |
| Tuesday, January 1, 2019 | 9471661000 | 8552000000 |
| Wednesday, January 1, 2020 | 9420400000 | 8828000000 |
| Friday, January 1, 2021 | 9409971000 | 10996000000 |
| Saturday, January 1, 2022 | 10048149000 | 12709000000 |
| Sunday, January 1, 2023 | 11982421000 | 13096000000 |
| Monday, January 1, 2024 | 12259730000 |
Unleashing insights
In the ever-evolving landscape of global IT services, understanding cost efficiency is crucial. This analysis delves into the cost of revenue trends for two industry giants: Infosys Limited and CGI Inc., from 2014 to 2023. Over this decade, Infosys Limited has shown a remarkable 144% increase in its cost of revenue, peaking at approximately $13.1 billion in 2023. Meanwhile, CGI Inc. has experienced a 48% rise, reaching around $12.3 billion in the same year.
The data for 2024 is incomplete, highlighting the dynamic nature of financial reporting. These insights provide a window into the strategic priorities of these tech titans.
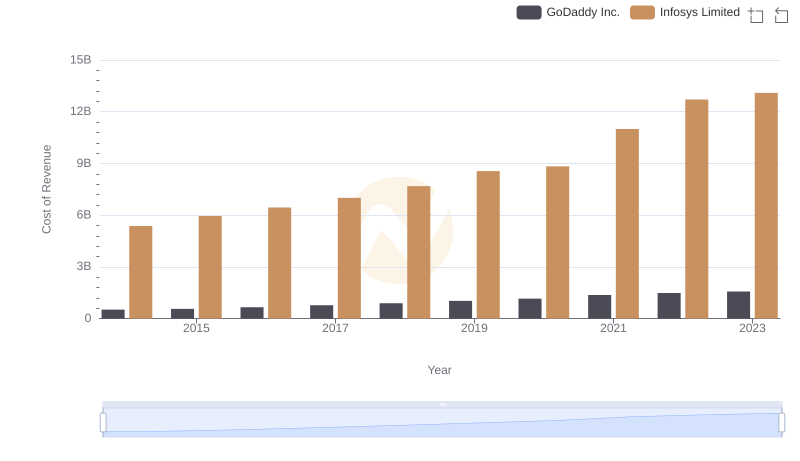
Cost of Revenue: Key Insights for Infosys Limited and GoDaddy Inc.
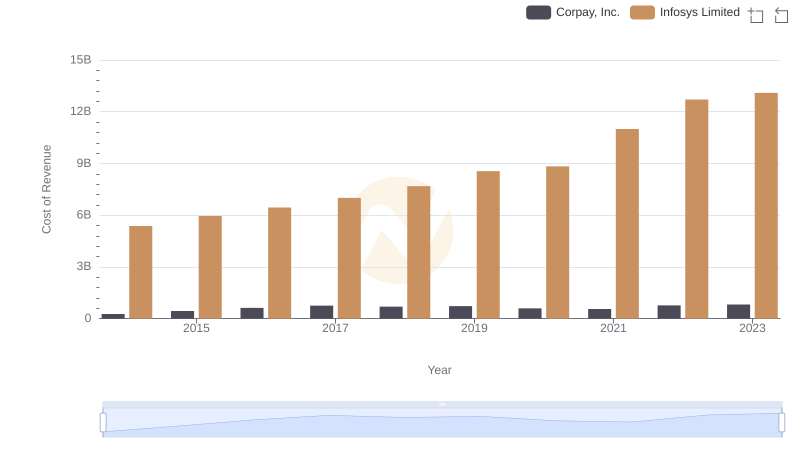
Analyzing Cost of Revenue: Infosys Limited and Corpay, Inc.
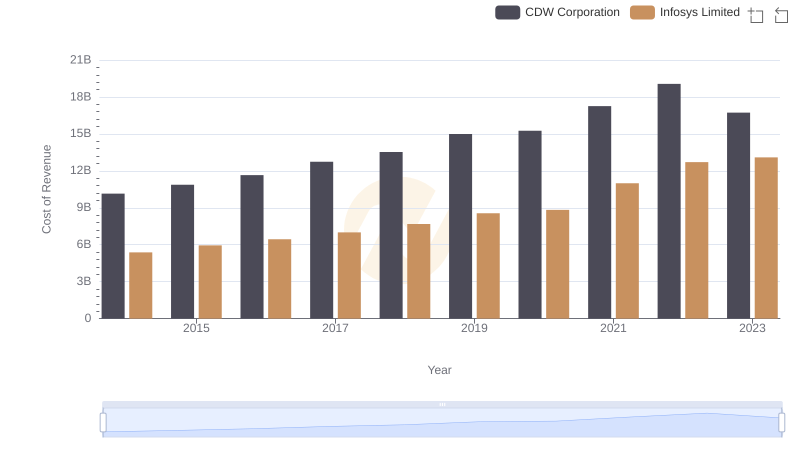
Cost of Revenue: Key Insights for Infosys Limited and CDW Corporation
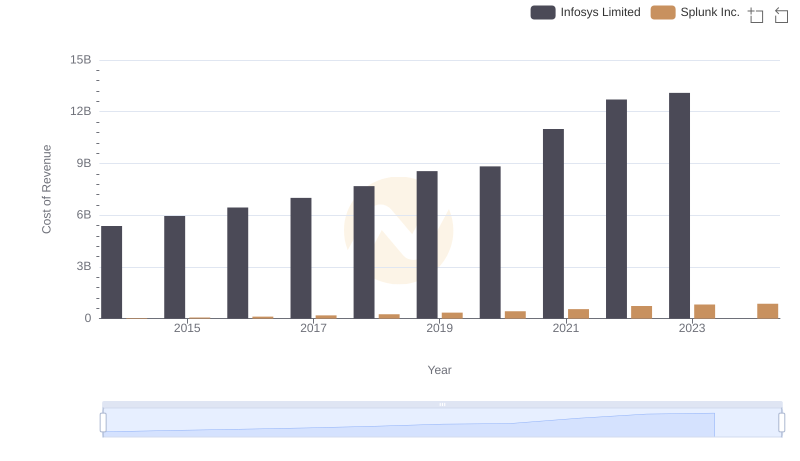
Infosys Limited vs Splunk Inc.: Efficiency in Cost of Revenue Explored
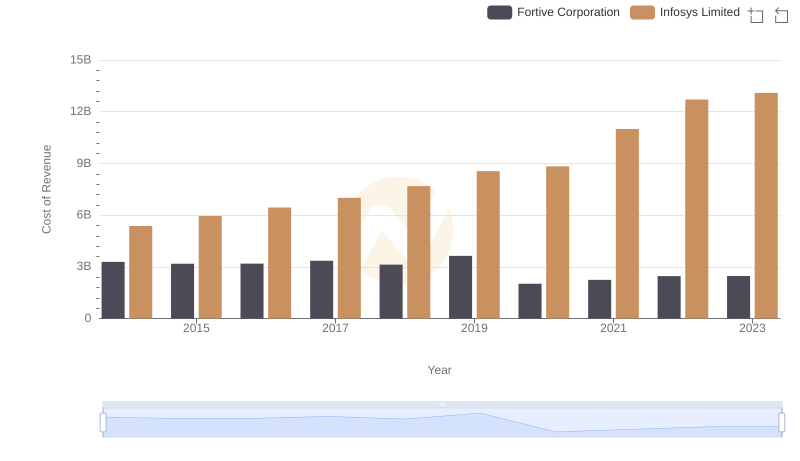
Comparing Cost of Revenue Efficiency: Infosys Limited vs Fortive Corporation
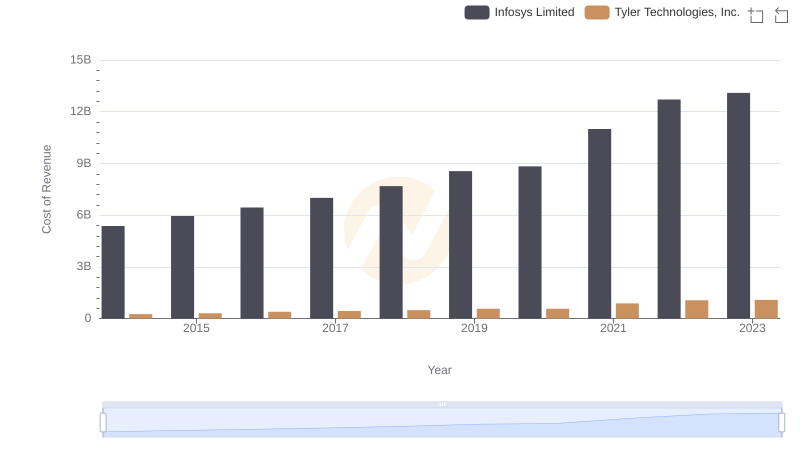
Cost of Revenue: Key Insights for Infosys Limited and Tyler Technologies, Inc.
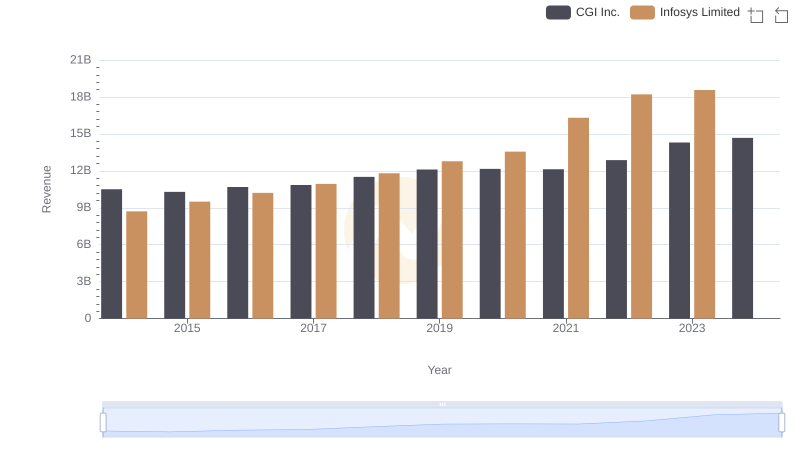
Infosys Limited or CGI Inc.: Who Leads in Yearly Revenue?
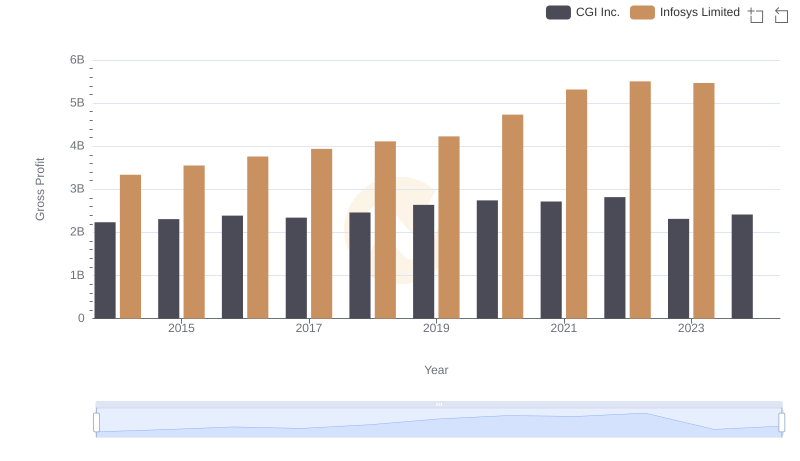
Gross Profit Comparison: Infosys Limited and CGI Inc. Trends
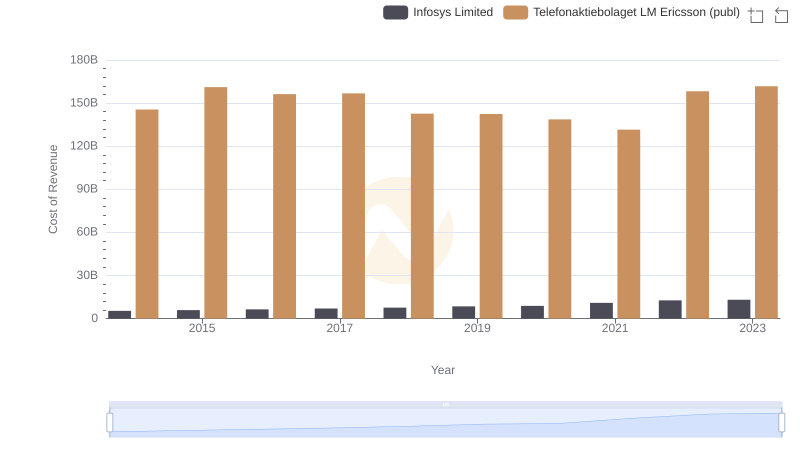
Infosys Limited vs Telefonaktiebolaget LM Ericsson (publ): Efficiency in Cost of Revenue Explored
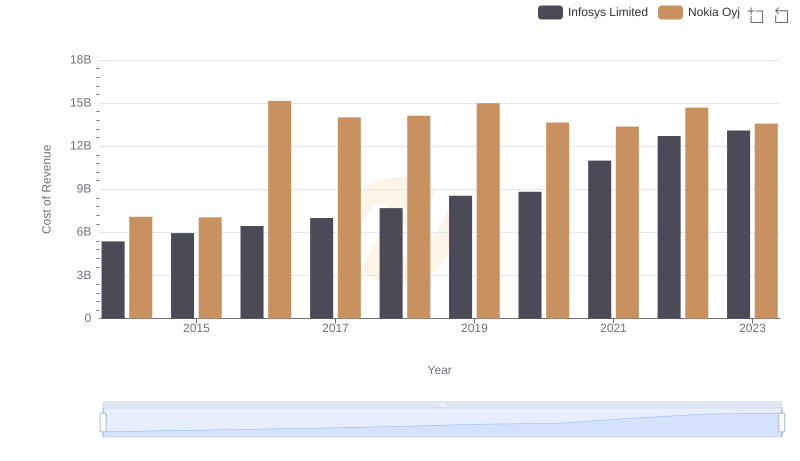
Cost Insights: Breaking Down Infosys Limited and Nokia Oyj's Expenses
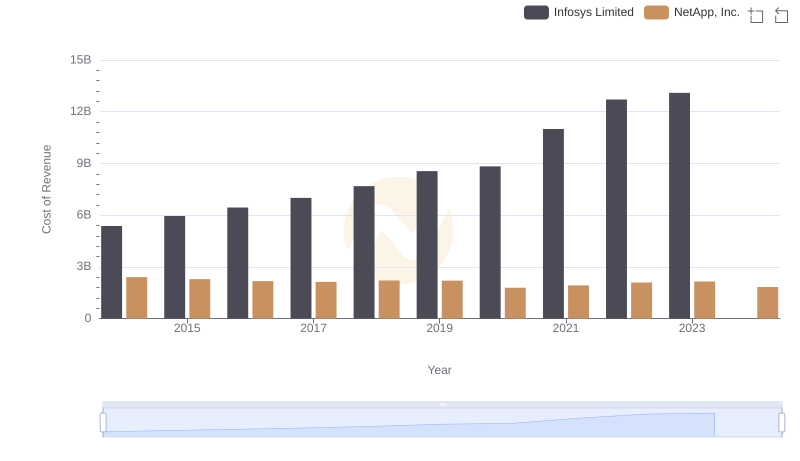
Cost of Revenue Comparison: Infosys Limited vs NetApp, Inc.
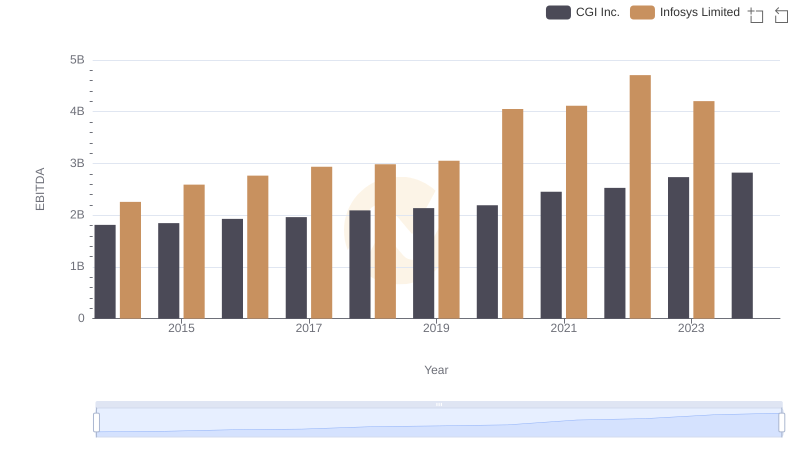
A Professional Review of EBITDA: Infosys Limited Compared to CGI Inc.