| __timestamp | Fidelity National Information Services, Inc. | Infosys Limited |
|---|---|---|
| Wednesday, January 1, 2014 | 810500000 | 1079000000 |
| Thursday, January 1, 2015 | 1102800000 | 1176000000 |
| Friday, January 1, 2016 | 1710000000 | 1020000000 |
| Sunday, January 1, 2017 | 1442000000 | 1279000000 |
| Monday, January 1, 2018 | 1301000000 | 1220000000 |
| Tuesday, January 1, 2019 | 2667000000 | 1504000000 |
| Wednesday, January 1, 2020 | 3516000000 | 1223000000 |
| Friday, January 1, 2021 | 3938000000 | 1391000000 |
| Saturday, January 1, 2022 | 4118000000 | 1678000000 |
| Sunday, January 1, 2023 | 2096000000 | 1632000000 |
| Monday, January 1, 2024 | 2185000000 |
Unleashing the power of data
In the ever-evolving landscape of global business, operational efficiency is paramount. A key indicator of this efficiency is the Selling, General, and Administrative (SG&A) expenses. This analysis delves into the SG&A trends of two industry giants: Infosys Limited and Fidelity National Information Services, Inc., from 2014 to 2023.
Over the past decade, Fidelity National Information Services has seen a significant increase in SG&A expenses, peaking in 2022 with a 408% rise from 2014. In contrast, Infosys Limited maintained a more stable trajectory, with a modest 55% increase over the same period. Notably, 2020 marked a pivotal year for both companies, with Fidelity's expenses surging by 31% compared to the previous year, while Infosys experienced a slight dip.
This comparative analysis underscores the strategic differences in operational spending between these two tech titans, reflecting their unique market strategies and growth trajectories.
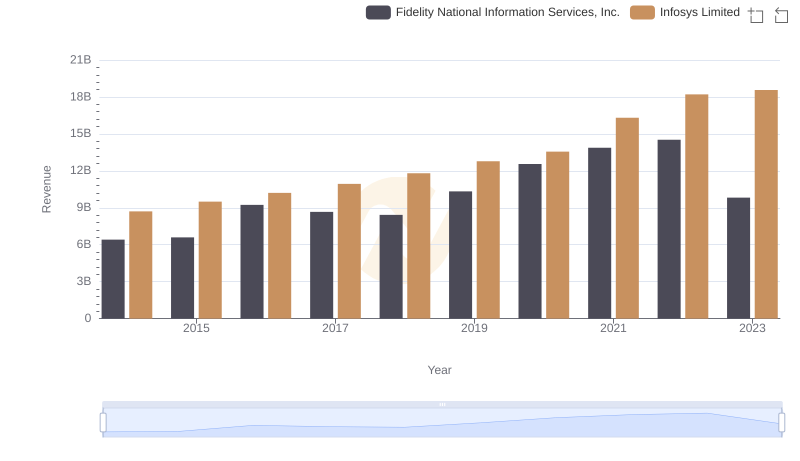
Comparing Revenue Performance: Infosys Limited or Fidelity National Information Services, Inc.?
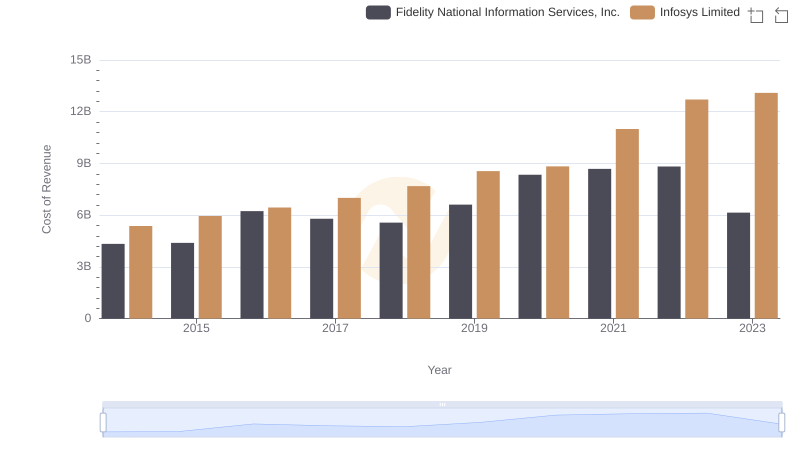
Infosys Limited vs Fidelity National Information Services, Inc.: Efficiency in Cost of Revenue Explored
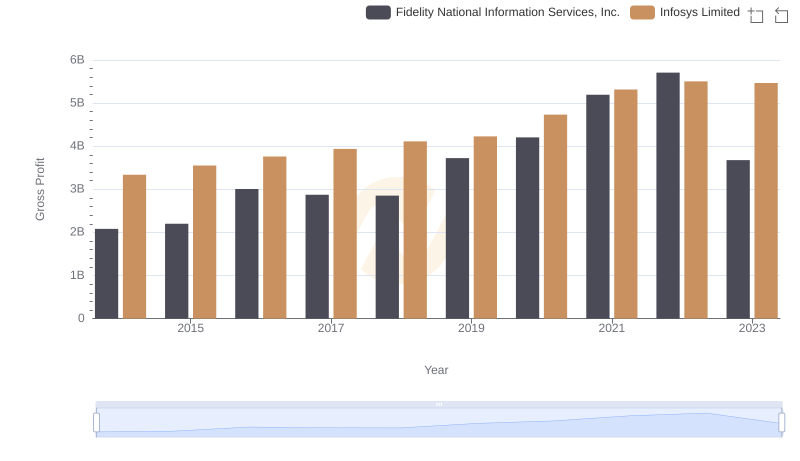
Who Generates Higher Gross Profit? Infosys Limited or Fidelity National Information Services, Inc.
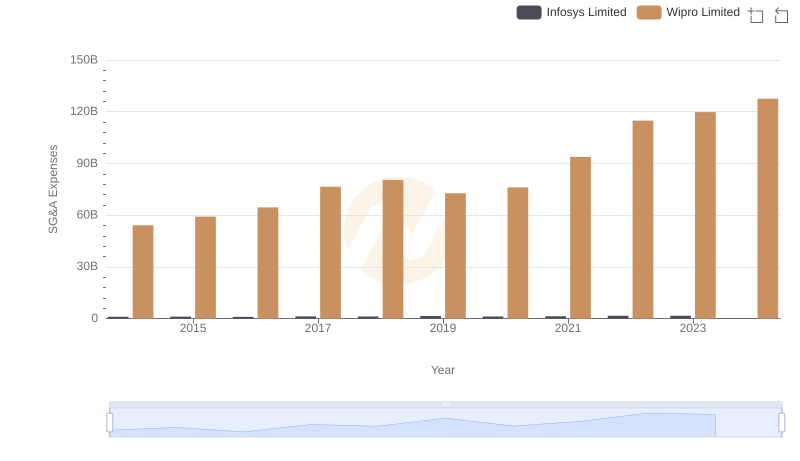
Cost Management Insights: SG&A Expenses for Infosys Limited and Wipro Limited
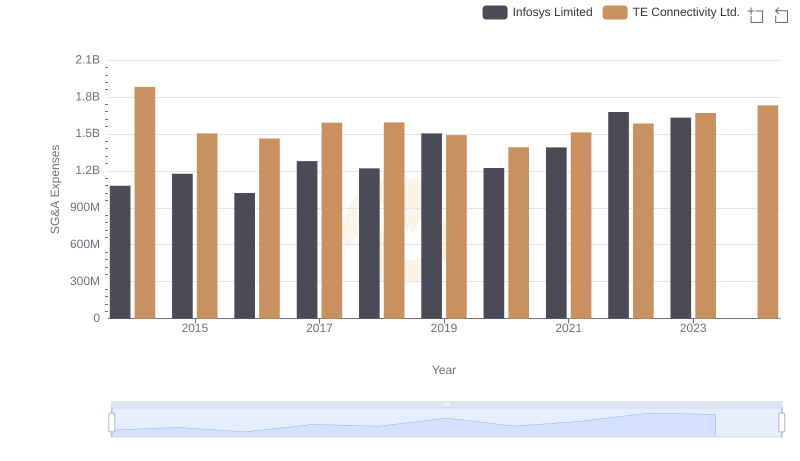
Breaking Down SG&A Expenses: Infosys Limited vs TE Connectivity Ltd.
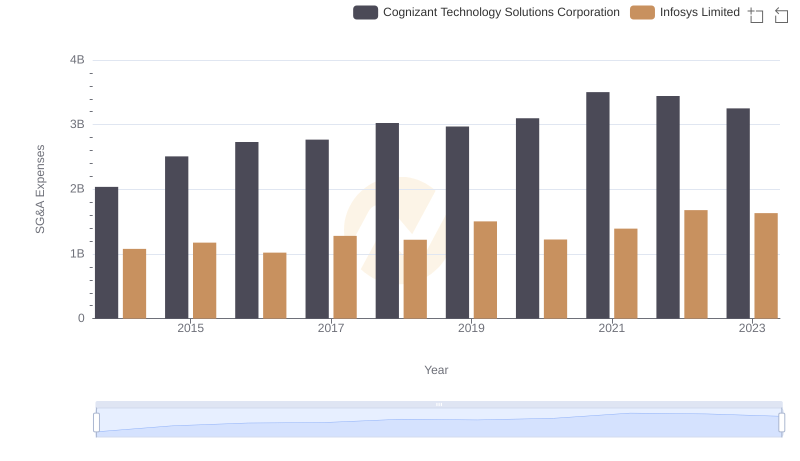
Infosys Limited and Cognizant Technology Solutions Corporation: SG&A Spending Patterns Compared
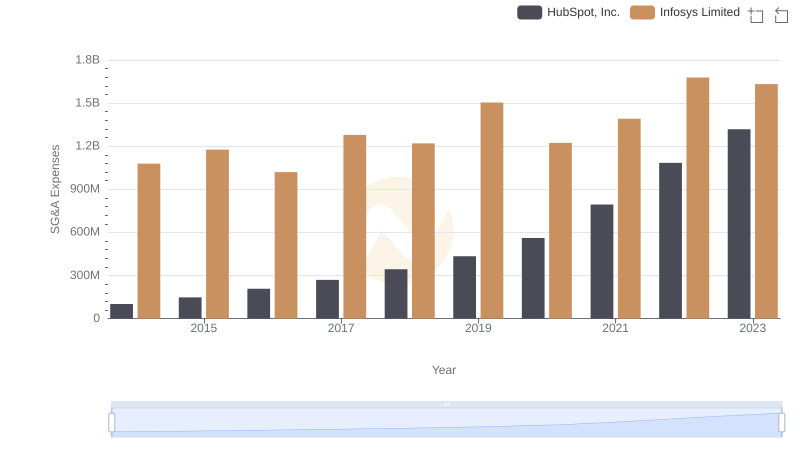
Infosys Limited or HubSpot, Inc.: Who Manages SG&A Costs Better?
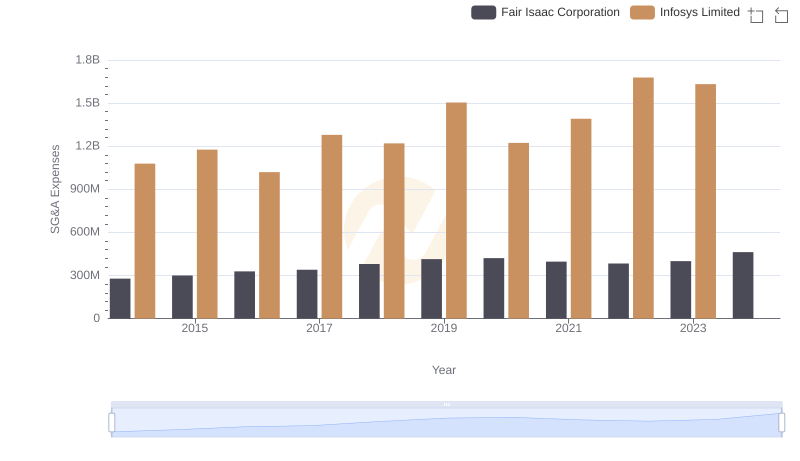
Who Optimizes SG&A Costs Better? Infosys Limited or Fair Isaac Corporation
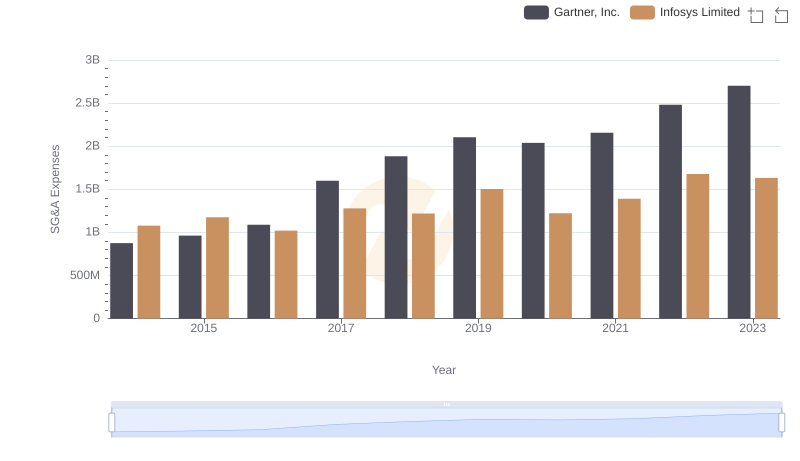
Cost Management Insights: SG&A Expenses for Infosys Limited and Gartner, Inc.
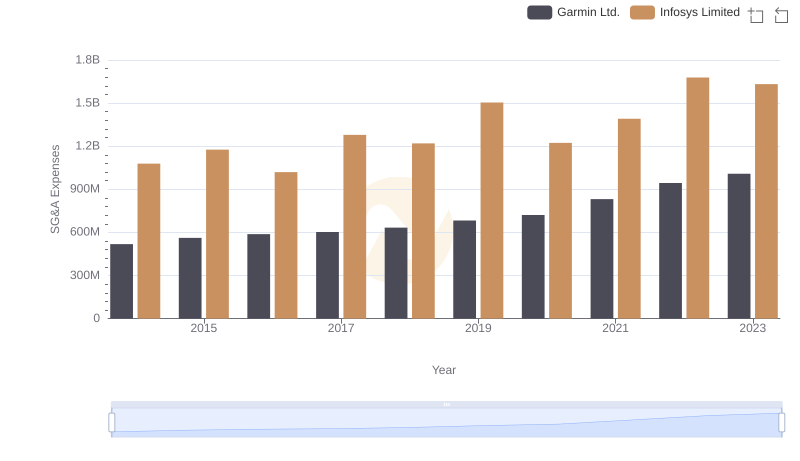
Infosys Limited and Garmin Ltd.: SG&A Spending Patterns Compared
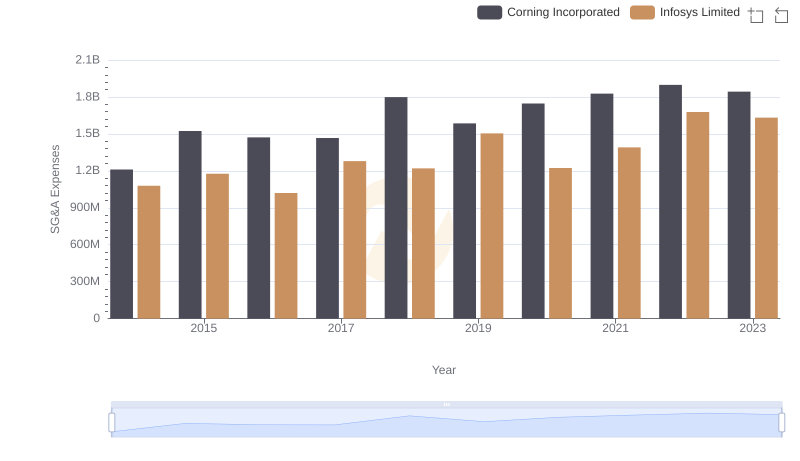
Selling, General, and Administrative Costs: Infosys Limited vs Corning Incorporated
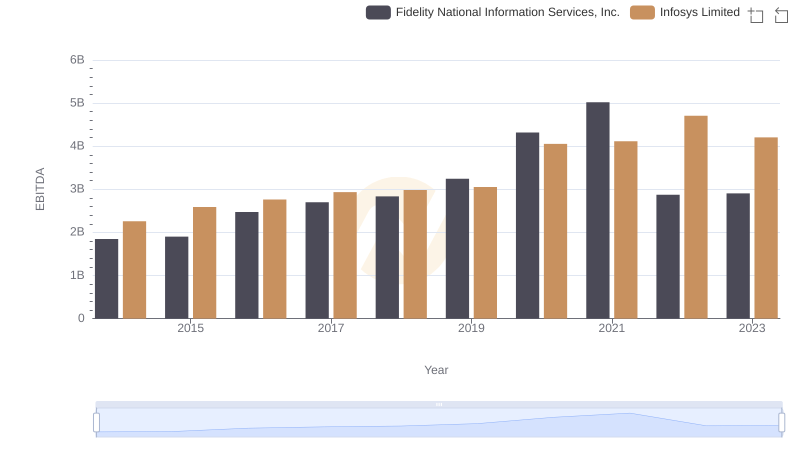
A Professional Review of EBITDA: Infosys Limited Compared to Fidelity National Information Services, Inc.